Home Modifications for Rural Veterans With Disabilities


Background : Appropriate home modifications (HMs) can make the home environment accessible and relatively safe by reducing the risk of falls. Of special concern are individuals living alone, living in rural communities, and/or living in substandard housing. The Home Improvements and Structural Alterations (HISA) is a Veterans Health Administration (VHA) benefit program providing HMs for veterans with disabilities.
Methods: The objective of this study was to detail the profile of rural veteran (RV) HISA users and report on national HISA utilization patterns. We compare use at US Department of Veterans Affairs (VA) medical centers of varying complexity levels, and in VA regions. An examination of the relationship between travel time/distance and HISA utilization is also provided. This retrospective database study uses GeoSpatial analyses and 3 VA sources: The National Prosthetics Patient Database, the VHA Medical Inpatient Dataset, and the VHA Outpatient Dataset.
Results: From 2015 through 2018, 10,810 RVs used HISA with a mean age of 70.9 years. A majority of participants were White (79.5%), married (74.3%), and male (96.5%) veterans. They traveled a mean of 79.8 miles for 94.5 minutes to reach a facility where they received a HISA prescription. Nearly 75% of HISA users were able to receive a HISA prescription from their nearest facility, while about one-quarter traveled to a facility farther away, of which 43% travelled between 100 and 200 miles to obtain the HISA benefit. The top categories of diagnoses were musculoskeletal (19.1%), neurologic (12.5%), and cardiovascular (5.4%). There were about 11,166 HM prescriptions afforded to rural HISA users during the period, including bathroom (82.4%), doorway (4.9%), and railing (3.6%) modifications.
Conclusions: This study documents the national demographics and clinical characteristics of rural HISA users, data that may be useful to policy makers, HM service providers and advocate as well as HISA administrators in predicting future use and users.
Study Variables
VWDs of any age, gender, and race/ethnicity who qualified for HISA and received HMs from fiscal year ( FY) 2015 through FY 2018 were identified (N = 30,823). Most VWDs were nonrural subjects (n = 19,970), and 43 had no Federal Information Processing System data. The final study cohort consisted of 10,810 HISA recipients. The NPPD, inpatient and outpatient data were merged by scrambled social security numbers to retrieve the following data: age, gender, race, ethnicity, marital status, Class (1 or 2), mean and total number of inpatient days, and type of HMs prescribed.
We also recorded rurality using the VA Rural-Urban Commuting Areas (RUCA) system, but we combined the rural and highly rural designation.1 Census tracts with a RUCA score of 10.0 are deemed highly rural, the remainder are considered rural except those with a RUCA score of 1.0 or 1.1. Travel time and distance from a veteran’s home to the VA facility that provided the HISA prescription were determined from zip codes. The current study focuses on VAMCs prescribing stations (affiliated sites of administrative parent medical facilities) where the HISA users obtained the HM, not the parent station (administrative parent medical facilities).
HISA Utilization
To characterize HISA utilization geographically and over time, the number of users were mapped by county. Areas where users were increasing (hot spots) or decreasing (cold spots) also were mapped. The maps were created using Environmental Systems Research Institute ArcGIS Pro 2.2.1 software. We chose to use natural breaks (Jenks) data classification method in a choropleth to symbolize the change over time map. We then used the Getis Ord GI* optimized hot spot analysis tool in the ArcGIS Pro spatial statistics tool set to generate the hot/cold spot maps. This tool identifies clusters of high values (hot spots) and low values (cold spots) creating a new output layer, RHUs by county, with a Z score, P value, and CI for each county. The Gi Bin field classifies statistically significant hot and cold spots. Counties sorted into the ± 3 category (bin) have a clustering characteristic (eg, with neighboring counties) that is statistically significant with a 99% CI; the ± 2 bin indicates a 95% CI for those county clustering sorted therein; ± 1 reflects a 90% CI; and 0 bin contains county features that have no statistical significant clustering with neighboring counties.
Data Analysis
Data were cleaned and analyzed using SAS 9.4 and R 3.5.3. Descriptive statistics are provided for sociodemographic characteristics, clinical characteristics, and class. ANOVA and t tests were used to compare continuous variables between groups, while χ2 and Fisher exact tests were used for dichotomous and categorical outcome variables. The threshold for statistical significance for these tests was set at α = .001.
Results
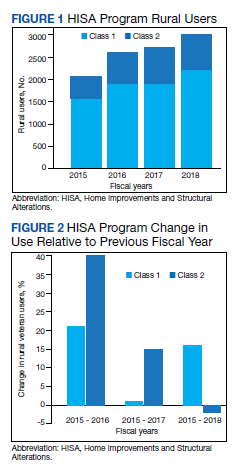
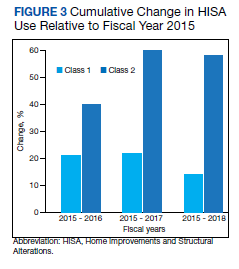
There were 10,810 RHUs from FY 2015 through FY 2018 and HISA utilization increased each year (Figure 1). Although some years may show usage decreases relative to previous fiscal years, the cumulative trends showed an increase relative to FY 2015 for both Classes of RVs (Figure 2). There was a 45.4% increase from FY 2015 to FY 2018 with a mean 13.6% yearly increase. Class 1 increased 21.0% and Class 2 increased 39.5% from FY 2015 to FY 2016 (Figure 3).