Augmented Reality Demonstration Survey Results From a Veteran Affairs Medical Center


Background: Augmented reality (AR) has a wide range of potential applications to enhance health care. Understanding how the introduction of a new technology may impact employees is essential for overall health care system success.
Methods: Survey responses were obtained before and after a health care–focused interactive AR demonstration at a US Department of Veterans Affairs (VA) medical center. Data were assessed with descriptive statistics, Wilcoxon signed rank matched pairs test, pooled t test, and analysis of variance.
Results: A total of 166 individuals participated in the demonstration and survey. Statistically significant improvements were seen after the use of the new AR technology in each of the categories assessed using a 5-point Likert scale. Scores for perceptions of institutional innovativeness increased from 3.4 to 4.5 (a 22% increase; P < .001); employee excitement about the VA increased from 3.7 to 4.3 (a 12% increase; P < .001); and employee likelihood to continue working at VA increased from 4.2 to 4.5 (a 6% increase; P < .001). Subgroup analysis demonstrated statistically significant differences by employee veteran status, VA tenure, and sex. Respondents felt strongly that this type of work will positively impact health care and that the VA should continue these efforts.
Conclusions: An AR demonstration significantly increased employee excitement and intention to continue employment at the VA and provided valuable insights about the most impactful uses of AR in health care.
Setting and Participants
We reviewed published studies that used questionnaires to evaluate institutions’ level of innovation and new technology user acceptance to develop the questionnaire.49-56 Questions and methods were modified, with a focus on understanding the impact on hospital employees. The questionnaire consisted of 2 predemonstration and 3 postdemonstration sections. The first section included background questions. The second (predemonstration) and third (postdemonstration) sections provided matched questions on feelings about the VA. The fourth section included 2 unmatched questions about how the participant felt this technology would impact veterans and whether the VA should implement similar technologies. We used a 5-point Likert scale for sections 2, 3 and 4 (1 = not at all to 5 = extremely). Two unmatched free-text questions asked how the technology could be used in the participant’s hospital service, and another open-ended question asked for any additional comments. To reduce potential reporting bias, 2 VA employees that did not work at VAPAHCS assisted with the survey distribution and collection. VAPAHCS staff were informed by all employee email and facility intranet of the opportunity to participate; the voluntary demonstration and survey took place on February 10 and 11, 2020.
Data Analysis
All matching pre/post questions were analyzed together to determine statistically significant differences using the Wilcoxon signed rank matched pairs test and pooled t test. Survey respondents were also grouped by employment type to evaluate the impact on subgroups. Results were also grouped by VA tenure into 4 categorical 10-year increments (0-10, 11-20, 21-30, 31-40). Additionally, analysis of variance (ANOVA) was performed on employment types and VA tenure to understand whether there was a statistically significant difference in responses by these subgroups. Respondents’ optional free-text answers were manually reviewed by 2 authors (ZPV and DMA), classified, coded by the common themes, and analyzed for comparison.
Results
A total of 166 participants completed the predemonstration survey, which was a requirement for participating in the AR demonstration. Of those, 159 staff members (95.8%) also completed at least part of the postdemonstration paired structured questions, and their results were included in the analysis. 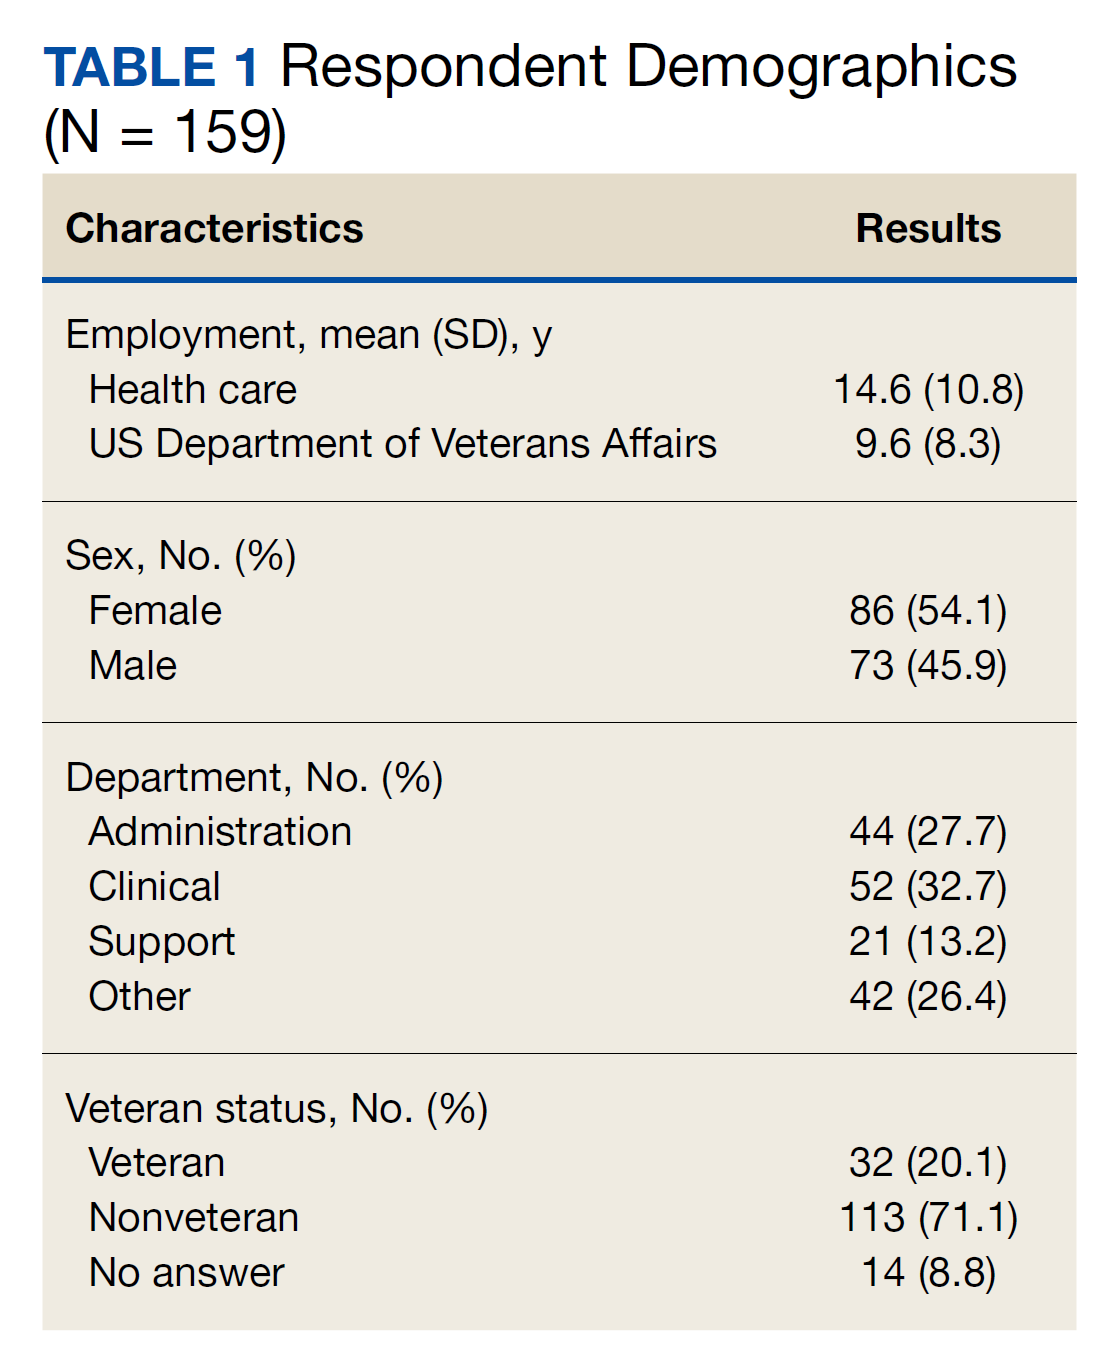
Paired Questions
For questions about how innovative the VA is, 108 of 152 participants (71.1%) provided higher scores after the demonstration, 42 (27.6%) had no change, and 2 (1.3%) provided decreased scores. The mean innovative score increased from 3.4 predemonstration to 4.5 postdemonstration on a Likert scale, which is a 1.1 point increase from predemonstration to postdemonstration (95% CI, 0.9- 1.2) or a 22% increase (95% CI, 18%-24%) (P < .001). Respondents level of excitement about VA also increased with 82 of 157 participants (52.2%) providing higher scores after the demonstration, 71 (45.2%) had no change, and 4 scores (2.5%) decreased. The predemonstration mean excitement score of 3.7 increased to 4.3 postdemonstration, which is a 0.6 point increase from before to after the demonstration (95% CI, 0.5-0.7) or a 12% increase (95% CI, 10%-14%) (P < .001). In the survey, 36 of 149 participants (24.2%) had higher scores for their expectation to continue working at VA postdemonstration, 109 (73.2%) had no change, and 4 scores (2.7%) decreased. The mean employee retention score increased from 4.2 predemonstration to 4.5 postdemonstration, which is a 0.3 point increase between pre/post (95% CI, 0.2-0.4) or a 6% increase (95% CI, 4%-8%) (P < .001)
The pre/post questions were analyzed using 1-way ANOVA by hospital department and VA tenure. The responses by department were not statistically significant. Of the 159 employees assessed, 101 respondents (63.5%) had 0 to 10 years VA tenure, 44 (27.7%) had 11 to 20 years, 10 (6.3%) had 21 to 30 years, and 4 (2.5%) had > 31 to 40 years. Length of VA tenure did not impact respondent excitement. Respondents opinions on innovation in the 0 to 10 year and the 11 to 20 year groups rose from 3.2 and 3.7 predemonstration to 4.3 and 4.6 postdemonstration, respectively (P < .001 for both statistical comparisons) (Table 2). Interestingly, the 0 to 10 group saw a 9% rise from a 4.0 score predemonstration to a 4.4 score postdemonstration (P < .001), indicating that the demonstration had a positive impact on their plans to continue employment at VA (Table 3).