Reducing Benzodiazepine Prescribing in Older Veterans: A Direct-to-Consumer Educational Brochure


Quality Improvement Project 2
Of all the VISN 22 and VISN 21 veterans, 24,420 met the inclusion and exclusion criteria. Of these 24,420 veterans, 2,020 (8.3%) were in VISN 22 and received the EB between December 2014 and August 2015 (QIP-1), and 22,400 (91.7%) were in VISN 21 and did not receive the EB.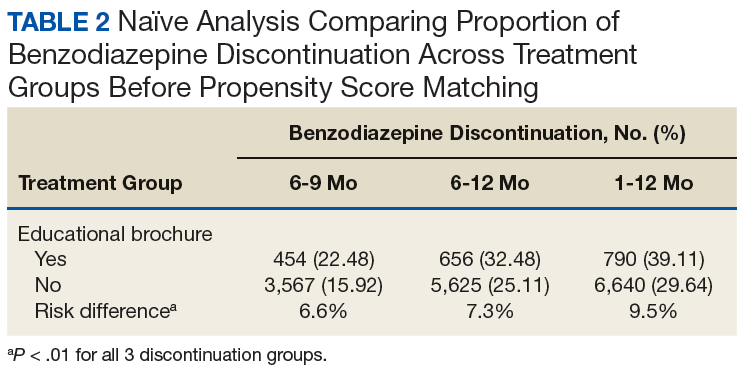
Naïve Results Before PS Matching. In the naïve analyses, a larger proportion of EB-exposed vs unexposed veterans discontinued BZD; in addition, reductions were 6.6%, 7.4%, and 9.5% larger for 6 to 9 months, 6 to 12 months, and 1 to 12 months after the index date, respectively (P < .0001 for all comparisons; Table 2). 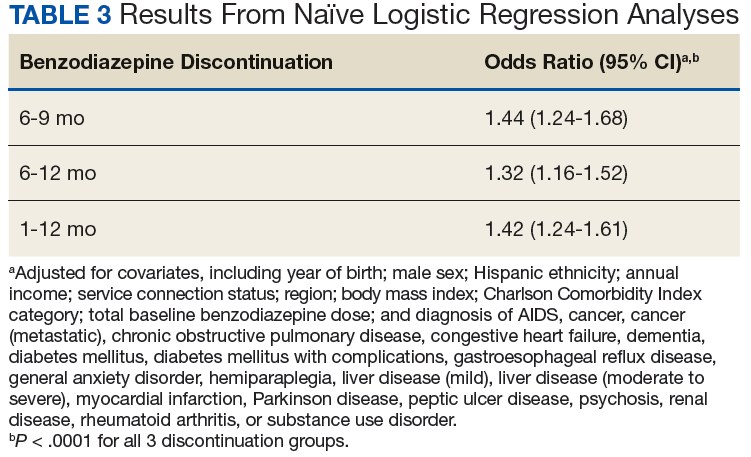
After controlling for potential confounders, the naïve logistic regression analyses found EB exposure was significantly associated with 44%, 32%, and 42% increases in the odds of BZD discontinuation for 6 to 9 months, 6 to 12 months, and 1 to 12 months after the index date, respectively (Table 3). 
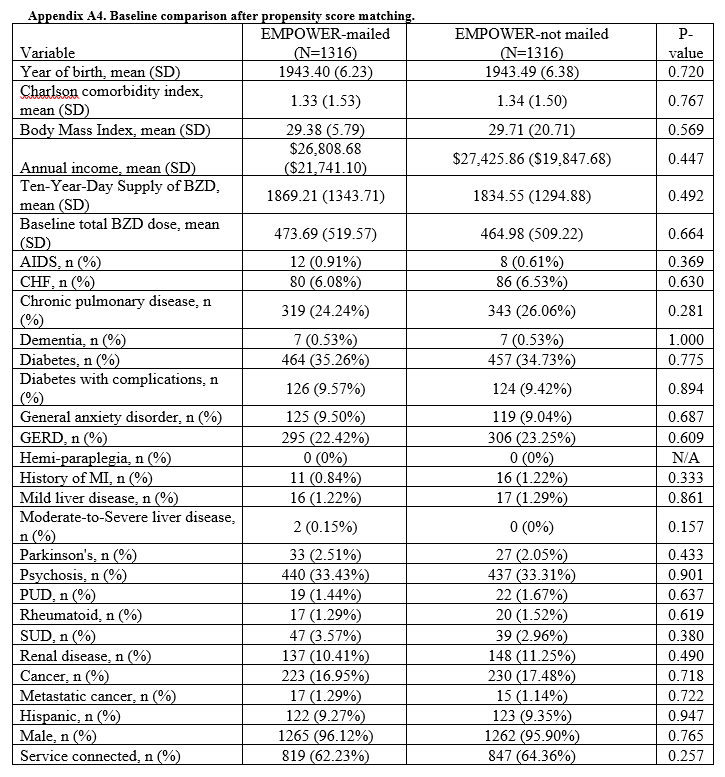
Propensity Score Matching. Before matching, there were significant differences in baseline characteristics of veterans who met the inclusion and exclusion criteria, with few exceptions (eAppendices 2 and 3, ).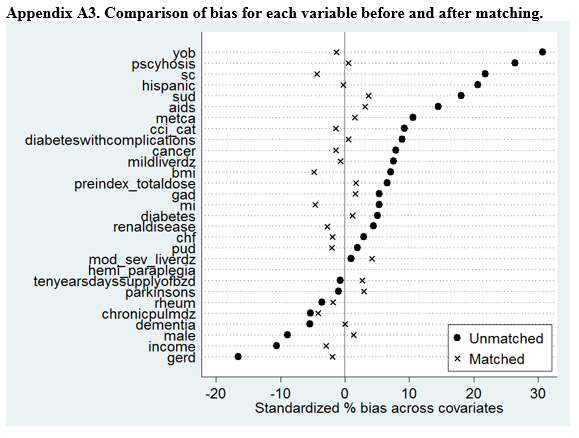
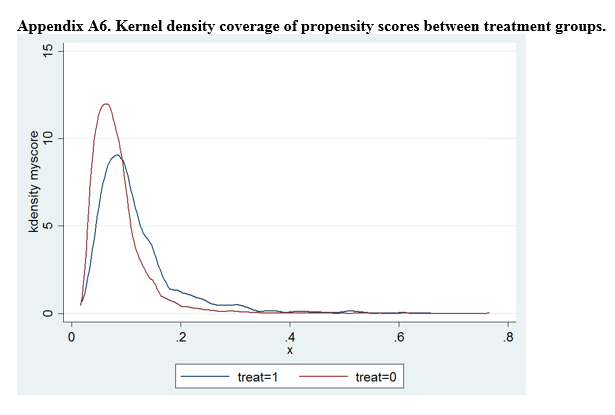
Propensity Score Matching Results. Inspection of PSs revealed good coverage across treatment groups on a histogram plot and a kernel density plot (eAppendices 5 and 6). 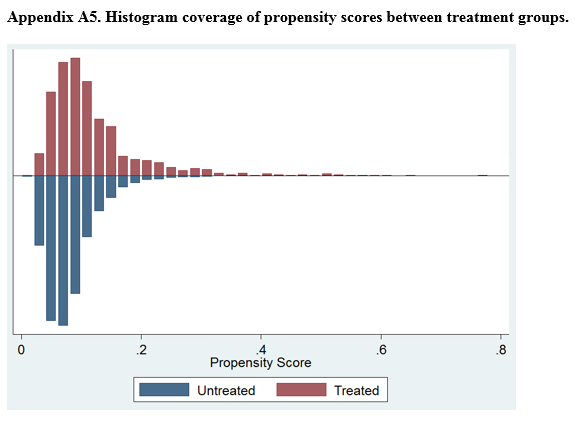

Discussion
This QIP was the first to evaluate the impact of an EMPOWER-modeled DTC EB in a large, integrated health care system in the U.S. It was also the first to demonstrate potential benefits of a DTC EB designed for older veterans who are long-term BZD users. In this QIP, which mailed the EB to 3,896 veterans, 1,847 (47.4%) decreased their BZD dose, 458 (11.7%) tapered and then discontinued BZD, and 455 (11.7%) immediately discontinued BZD. The total percentage of veterans who discontinued BZD (23.4%; 913/3,896) was similar to the 27% reported in the EMPOWER trial.17 However, the risk difference between the 1,316 EB-exposed VISN 22 veterans (QIP-1) and the 1,316 EB-unexposed VISN 21 veterans in this QIP was significantly lower than the 23% risk difference in EMPOWER (though it still demonstrated a significantly larger reduction for EB-exposed veterans).17
Given this inclusion of all qualifying veterans from the catchment area studied in this QIP, and given the ethical and practical concerns, an RCT was not possible. Therefore, PSM methods were used to balance the covariates across treatment groups and thereby simulate an RCT.21,22,27 With use of the PSM approach, findings from the descriptive analysis were confirmed and potential selection bias reduced.