Shared Medical Appointments and Their Effects on Achieving Diabetes Mellitus Goals in a Veteran Population


Methods
This study was a retrospective chart review conducted at the JBVAMC and was approved by the institutional review board and the research and development committee. Patient confidentiality was maintained by identifying patients by means other than name or unique identifiers. Protected health information was accessible only by the aforementioned investigators. There was no direct patient contact during this study.
Patient lists were generated from the computerized patient record system (CPRS). Patients were tracked up to 6 months after SMA discharge or until the last SMA in which they participated. The control group was matched according to location, age, glycemic control, and time. The control group never attended an ABJ SMA but may have received regular care through their primary care provider, CPS, or endocrinologist. Prospective control group patients were randomized and reviewed sequentially to obtain the matched cohort.
The study took place at ABJ, an outpatient clinic serving veterans in northwest Indiana and surrounding areas. Inclusion criteria for the SMA group were patients with T2DM, aged ≥ 45 years, with an A1c ≥ 8.5% seen at ABJ for T2DM from May 1, 2011, to June 30, 2013. The control group included patients with T2DM, aged ≥ 45 years, with an A1c > 9% who never attended SMAs but may have received regular care at ABJ during the study period. The SMA group’s inclusion criteria threshold for A1c was lower in order to maximize sample size. The control group’s inclusion criteria threshold for A1c was higher due to use of a default reminder report called “A1c > 9%” to generate patient lists. Patients were excluded from the study if they did not meet inclusion criteria.
Baseline datum was the most recent parameter available in CPRS prior to enrollment. The endpoint datum was the parameter nearest the time of SMA discharge or the first available parameter within 6 months from the date of discharge. In the control group, the baseline datum was the initial parameter during the study period and the endpoint datum was the closest measure to 4 months after baseline. Four months was chosen to allow for at least 1 A1c measurement during the study period. In addition, it was estimated (prior to collecting any data) that 4 months was the average time a patient participated in SMAs. Serial A1c measurements were defined as values obtained at SMA discharge and 3- and 6-months postdischarge. These parameters were used to evaluate the sustainability of improvements in glycemic control. All values falling outside of these defined parameters were excluded.
Related: Experiences of Veterans With Diabetes From Shared Medical Appointments
The data analysis compared A1c change from baseline to endpoint for the SMA and control groups. Data collection included baseline characteristics, SMA show rate, number of SMA patients seen by a CPS or NP, number and type of SMA interventions made by a CPS or NP, and the number and type of non-SMA interventions made during the study period. Intervention types were medications: added, discontinued, or titrated; and other, defined as referrals made to specialty services (such as dental, optometry, and podiatry).
Secondary endpoints included the number of SMAs and glycemic improvement, SMA format style (open- vs focused session) and glycemic improvement, SMA provider (CPS vs NP) and glycemic improvement, the change in A1c stratified by baseline A1c (A1c ≥ 10% vs < 10%), the change in actual body weight (ABW) and body mass index (BMI), and maintenance of A1c (3- and 6-months postdischarge).
The primary endpoint was evaluated using a 2-sample Student t test. Secondary endpoints were evaluated using the independent t test. Statistical significance was defined as P < .05.
Results
A total of 129 unique patients were scheduled for SMAs, 62 of which met inclusion criteria and were included in the SMA group. During enrollment, 67 patients were excluded: 55 never participated in SMAs, 6 had baseline A1c values < 8.5%, 4 had insufficient data, and 2 were aged < 45 years. A total of 29 SMAs were conducted during the study period, and patients attended an average of 3.15 ± 2.14 (SD) SMAs. The average attendance at each SMA was 7.1 ± 2.62 (SD) patients. For the control group, 754 unique patients were identified and randomized. A total of 90 charts were sequentially reviewed in order to obtain the 62 patients for the control group.
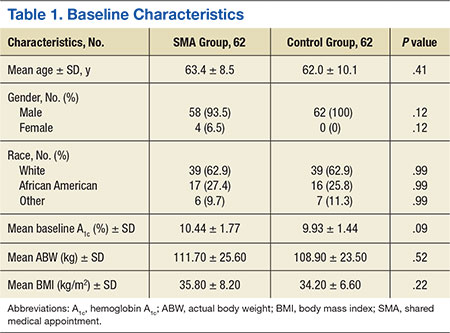
Baseline characteristics were balanced between groups. However, there were more women in the SMA group vs the control group (Table 1). Within the control group, there were a total of 107 appointments that addressed T2DM, which averaged 1.72 ± 1.51 (SD) appointments per patient. The total number of interventions made in the SMA group was 192: 64.6% (124) by a CPS and 35.4% (68) by a NP. For the CPS, the most frequent intervention was medication titration (69.5%), followed by other (23.5%), medication addition (4%), and medication discontinuation (3%). Of note, 53.2% (33) of the SMA patients were seen an average of 1.2 times by non-SMA providers. The SMA patients had a total of 45 non-SMA interventions (0.73 per patient) during the study period.