How to avoid 3 common errors in dementia screening


The simple solutions outlined here will help you to sharpen your evaluative tools and improve accuracy.
A widely used and accepted heuristic for gauging intelligence is “years of education.” Of course, education is not perfectly correlated with intelligence, particularly as those who are now elderly may have been denied the opportunity to attend school due to the Great Depression, war, or other life events. Nevertheless, with these limitations in mind, level of education is a reasonable approximation of intelligence. In practical application, premorbid intellectual level is determined by using education-corrected normative data.
Typically with cognitive tests, cutoff scores and score ranges are defined for general levels of education (eg, less than grade 12 or more than grade 12; elementary school, high school, post-secondary, etc). Adjusted norms for age and education are usually determined by taking large samples of subjects and stratifying the distribution by subgroups—eg, 5-year age groups; levels of education such as elementary school or high school—and then statistically analyzing each group and noting the relative differences between them.
Illustration: MMSE. Although not designed for the overall measurement of cognitive impairment in dementia, the MMSE10 has become widely used for that purpose. It is fairly insensitive to cognitive changes associated with earlier stages of dementia,14 and is intended only as a means of identifying patients in need of more comprehensive assessment. However, the MMSE is increasingly used to make a diagnosis of dementia.15 In some areas (eg, Ontario, Canada), it is used to justify paying for treatment with cognitive enhancers.

The universal cutoff score proves inadequate. Although several dementia cutoff scores for the MMSE have been proposed, it is common practice to use an MMSE score ≥24 to rule out dementia.16 In our clinical practice, however, many patients who ultimately are diagnosed with early dementia often perform well on the MMSE, although rather poorly on other dementia screens, such as the Kingston Standardized Cognitive Assessment-Revised (KSCAr)17 or the mini-KSCAr.18
Recently, we reviewed cases of >70 individuals from our outpatient clinic who were given the MMSE and were also diagnosed as having dementia by both DSM-IV (Diagnostic and Statistical Manual of Mental Disorders)19 and the National Institute of Neurological and Communicative Disorders and Stroke and the Alzheimer’s Disease and Related Disorders Association20 criteria. Over three-quarters (78%) of these cases had an MMSE score of ≥24. Based on MMSE scores alone, these individuals would have been declared “not demented.”17
Correcting for age and intelligence increases accuracy. Published age and education norms are available for the MMSE.21 In applying these norms to our sample described above, the number of misidentified patients drops to approximately one-third (35.7%). This means that instead of misidentifying 2 out of 3 cases, the age and education corrections reduced this to about one out of 3, thereby increasing sensitivity and specificity. While this is still an unacceptably high rate of false negatives, it shows the considerable value of using age and education corrections.
The challenge of optimizing sensitivity and specificity of dementia screening tools is ongoing. As a matter of interest, we include TABLE 1,4,18,22-24 which shows calculated sensitivities and specificities of some commonly used screening tests.
Another practical fix: Use distributions and percentile-based normative data
Instead of simple cutoff scores, test scores can be, and often are, translated into percentiles to provide a meaningful context for evaluation and to make it easier to compare scores between patients. Someone with a score at the 70th percentile has performed as well as or better than 70% of others in the group who have taken the test. Usually, the average range of a normal population is defined as being between the 25th to 75th percentiles, encompassing 50% of that population. In general, percentiles make interpreting performance easier. Percentile-based test norms can also help determine with increased accuracy if there has been a decline over time.
Illustration: Animal naming task. In a common version of this task, patients are asked to name as many animals as they can in 60 seconds. This task has its roots in neuro- psychological tests of verbal fluency, such as the Controlled Oral Word Association Task.25 Verbal fluency tasks such as naming animals tap verbal generativity/problem-solving and self-monitoring, but are also highly dependent on vocabulary (word knowledge), a cognitive ability that is quite stable and even improves as one ages until individuals are well into their 80s.26
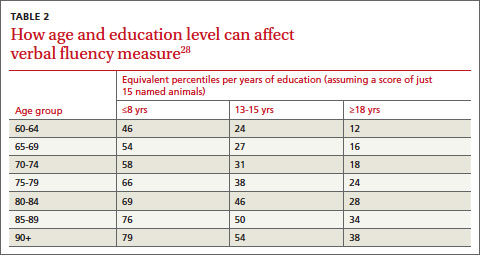
It is common practice with this procedure to consider a cutoff score of 15 as a minimally acceptable level of performance.27 Here again, there are potentially great differences in expected performance based on age and intelligence. TABLE 2 shows the effect of age and education on verbal fluency, expressed as percentiles, using a raw score of 15.28 For an individual in their early 60s who has a university degree, naming just 15 animals puts their performance at the 12th percentile (below average). The same performance for someone in their 90s who has only 8 years of education puts them in the 79th percentile (above the average range of 25th-75th percentiles). This performance would indicate impairment for the 60-year-old university-educated individual, but strong cognitive function for the 90-year-old.