Nationwide Hospital Performance on Publicly Reported Episode Spending Measures
BACKGROUND: Medicare has implemented strategies to improve value by containing hospital spending for episodes of care. Compared with payment models, publicly reported episode-based spending measures are underrecognized strategies.
OBJECTIVE: To provide the first nationwide description of hospitals’ episode-based spending based on publicly reported Clinical Episode-Based Payment (CEBP) measures.
DESIGN, SETTING, AND PARTICIPANTS: We used 2017 Hospital Compare data to assess spending on six CEBPs among 1,778 hospitals. We examined spending variation and its drivers, correlation between CEBPs, and spending by cost performance categories (for individual CEBPs, below vs above average spending; for across-CEBP comparisons, high vs low vs mixed cost). We also compared hospital spending performance on CEBPs with a global Medicare Spending Per Beneficiary measure.
MAIN OUTCOMES AND MEASURES: Episode spending. RESULTS: Episode spending varied by CEBP type, with skilled nursing facility (SNF) care accounting for the majority of spending variation for procedural episodes but not for condition episodes. Across CEBPs, greater proportions of episode spending were attributed to SNF care at high- (18.1%) vs mixed- (10.7%) vs low-cost (9.2%) hospitals (P > .001). There was low within-hospital CEBP correlation and low correlation and concordance between hospitals’ CEBP and Medicare Spending Per Beneficiary performance.
CONCLUSIONS: Variation reduction and savings opportunities in SNF care for procedural episodes suggest that they may be better suited for existing payment models than condition episodes are. Spending performance was not hospital specific, which highlights the potential utility of episode spending measures beyond global measures.
© 2020 Society of Hospital Medicine
Across hospitals in our sample, within-hospital correlations were generally low (Appendix Table 1). In particular, correlations ranged from
CEBP Performance by Hospital Groups
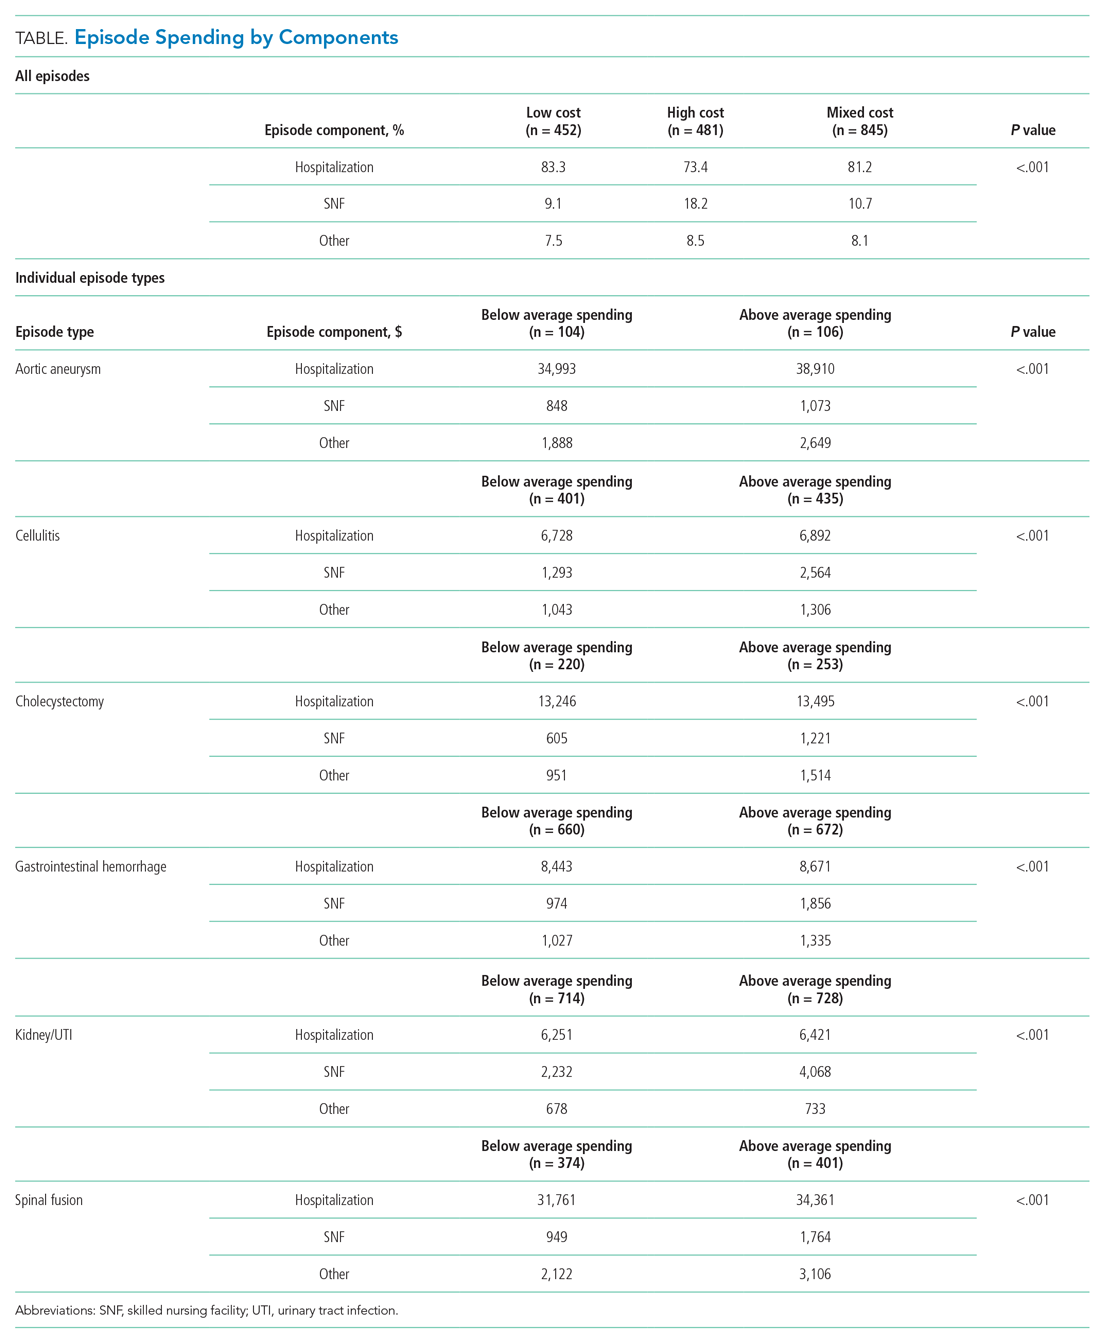
Overall spending on specific episode types varied across hospital groups (Table). Spending for aortic aneurysm episodes was $42,633 at hospitals with above average spending and $37,730 at those with below average spending, while spending for spinal fusion episodes was $39,231 at those with above average spending and $34,832 at those with below average spending. In comparison, spending at hospitals deemed above and below average spending for cellulitis episodes was $10,763 and $9,064, respectively, and $11,223 and $9,161 at hospitals deemed above and below average spending for kidney/UTI episodes, respectively.

Spending on specific episode components also differed by hospital group (Table). Though the magnitude of absolute spending amounts and differences varied by specific episode, hospitals with above average spending tended to spend more on SNF than did those with below average spending. For example, hospitals with above average spending for cellulitis episodes spent an average of $2,564 on SNF (24% of overall episode spending) vs $1,293 (14% of episode spending) among those with below average spending. Similarly, hospitals with above and below average spending for kidney/UTI episodes spent $4,068 (36% of episode spending) and $2,232 (24% of episode spending) on SNF, respectively (P < .001 for both episode types). Findings were qualitatively similar in sensitivity analyses (Appendix Table 2).
Among hospitals in our sample, we categorized 481 as high cost (27%), 452 as low cost (25%), and 845 as mixed cost (48%), with hospital groups distributed broadly nationwide (Appendix Figure 4). Evaluated on performance across all six episode types, hospital groups also demonstrated differences in spending by cost components (Table). In particular, spending in SNF ranged from 18.1% of overall episode spending among high-cost hospitals to 10.7% among mixed-cost hospitals and 9.2% among low-cost hospitals. Additionally, spending on hospitalization accounted for 83.3% of overall episode spending among low-cost hospitals, compared with 81.2% and 73.4% among mixed-cost and high-cost hospitals, respectively (P < .001). Comparisons were qualitatively similar in sensitivity analyses (Appendix Table 3).
Comparison of CEBP and Medicare Spending Per Beneficiary Performance
Correlation between Medicare Spending Per Beneficiary and aggregated CEBPs was 0.42 and, for individual episode types, ranged between 0.14 and 0.36 (Appendix Table 2). There was low concordance between hospital performance on CEBP and Medicare Spending Per Beneficiary. Across all eligible hospitals, only 16.3% (290/1778) had positive concordance between performance on the two measure types (ie, low cost for both), while 16.5% (293/1778) had negative concordance (ie, high cost for both). There was discordant performance in most instances (67.2%; 1195/1778), which reflecting favorable performance on one measure type but not the other.


