Nationwide Hospital Performance on Publicly Reported Episode Spending Measures
BACKGROUND: Medicare has implemented strategies to improve value by containing hospital spending for episodes of care. Compared with payment models, publicly reported episode-based spending measures are underrecognized strategies.
OBJECTIVE: To provide the first nationwide description of hospitals’ episode-based spending based on publicly reported Clinical Episode-Based Payment (CEBP) measures.
DESIGN, SETTING, AND PARTICIPANTS: We used 2017 Hospital Compare data to assess spending on six CEBPs among 1,778 hospitals. We examined spending variation and its drivers, correlation between CEBPs, and spending by cost performance categories (for individual CEBPs, below vs above average spending; for across-CEBP comparisons, high vs low vs mixed cost). We also compared hospital spending performance on CEBPs with a global Medicare Spending Per Beneficiary measure.
MAIN OUTCOMES AND MEASURES: Episode spending. RESULTS: Episode spending varied by CEBP type, with skilled nursing facility (SNF) care accounting for the majority of spending variation for procedural episodes but not for condition episodes. Across CEBPs, greater proportions of episode spending were attributed to SNF care at high- (18.1%) vs mixed- (10.7%) vs low-cost (9.2%) hospitals (P > .001). There was low within-hospital CEBP correlation and low correlation and concordance between hospitals’ CEBP and Medicare Spending Per Beneficiary performance.
CONCLUSIONS: Variation reduction and savings opportunities in SNF care for procedural episodes suggest that they may be better suited for existing payment models than condition episodes are. Spending performance was not hospital specific, which highlights the potential utility of episode spending measures beyond global measures.
© 2020 Society of Hospital Medicine
Pearson correlation coefficients were used to assess within-hospital CEBP correlation (ie, the extent to which performance was hospital specific). We evaluated if and how components of spending varied across hospitals by comparing spending groups (for individual episode types) and cost groups (for all episode types). To test the robustness of these categories, we conducted sensitivity analyses using high spending vs other spending groups (for individual episode types) and high SNF cost vs low SNF cost groups (for all episode types).
To assess concordance between CEBP and Medicare Spending Per Beneficiary, we cross tabulated hospital CEBP performance (high vs low vs mixed cost) and Medicare Spending Per Beneficiary performance (high vs low MSPB cost). This approached allowed us to quantify the number of hospitals that have concordant performance for both types of spending measures (ie, high cost or low cost on both) and the number with discordant performance (eg, high cost on one spending measure but low cost on the other). We used Pearson correlation coefficients to assess correlation between CEBP and Medicare Spending Per Beneficiary, with evaluation of CEBP performance in aggregate form (ie, hospitals’ average CEBP performance across all eligible episode types) and by individual episode types.
Chi-square and Kruskal-Wallis tests were used to compare categorical and continuous variables, respectively. To compare spending amounts, we evaluated the distribution of total episode spending (Appendix Figure 1) and used ordinary least squares regression with spending as the dependent variable and hospital group, episode components, and their interaction as independent variables. Because CEBP dollar amounts are reported through Hospital Compare on a risk-adjusted and payment-standardized basis, no additional adjustments were applied. Analyses were performed using SAS version 9.4 (SAS Institute; Cary, NC) and all tests of significance were two-tailed at alpha=0.05.
RESULTS
Of 3,129 hospitals, 1,778 achieved minimum thresholds and had CEBPs calculated for at least one of the six CEBP episode types.
Variation in CEBP Performance
For each episode type, spending varied across eligible hospitals (Appendix Figure 2). In particular, the difference between the 10th and 90th percentile values for cellulitis, kidney/UTI, and gastrointestinal hemorrhage were $2,873, $3,514, and $2,982, respectively. Differences were greater for procedural episodes of aortic aneurysm ($17,860), spinal fusion ($11,893), and cholecystectomy ($3,689). Evaluated across all episode types, the proportion of episode spending attributed to SNF care also varied across hospitals (Appendix Figure 3), with a difference of 24.7% between the 10th (4.5%) and 90th (29.2%) percentile values.
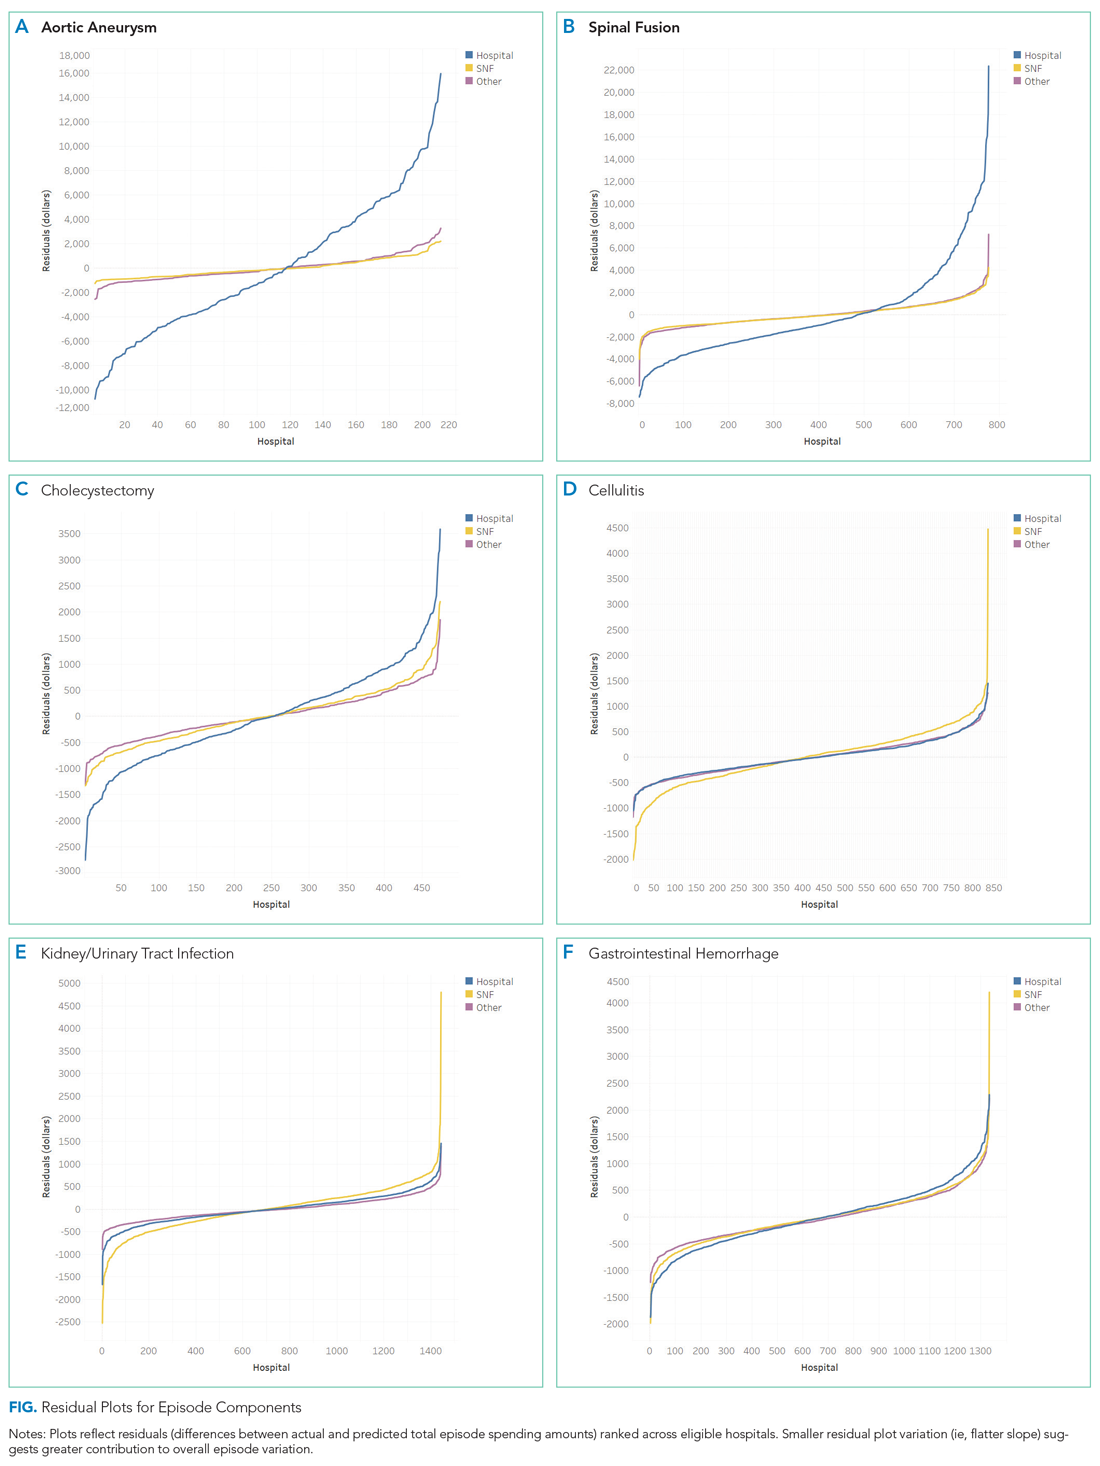
Residual plots demonstrated differences in which episode components accounted for variation in overall spending. For aortic aneurysm episodes, variation in the SNF episode component best explained variation in episode spending and thus had the lowest residual plot variation, followed by other and hospital components (Figure). Similar patterns were observed for spinal fusion and cholecystectomy episodes. In contrast, for cellulitis episodes, all three components had comparable residual-plot variation, which indicates that the variation in the components explained episode spending variation similarly (Figure)—a pattern reflected in kidney/UTI and gastrointestinal hemorrhage episodes.


