ADVERTISEMENT

Predictors of Suboptimal Glycemic Control for Hospitalized Patients with Diabetes: Targets for Clinical Action

Journal of Clinical Outcomes Management. 2015 April;April 2015, VOL. 22, NO. 4:

Results

Patient Characteristics

Table 1 shows patient demographic and clinical characteristics for the entire sample and for the top quartile (76% or greater POC blood glucose values within target range) and bottom quartile (25% or less POC blood glucose values within target range). Unadjusted results show a significant difference across quartiles for all factors except age, gender, dementia, rheumatic disease and paraplegia. Patients in the bottom 25th percentile (ie, the poorest control) were more likely than the total population to have a higher admission blood glucose (198 mg/dL vs. 153 mg/dL), higher HbA1c (8.53 [70mmol/mol] vs. 7.35 [57mmol/mol), a medical (74% vs. 66%) and/or respiratory (18% vs. 12%) diagnosis, corticosteroid use (17% vs. 27%), an insulin order set use (80% vs. 70%) and higher mean blood glucose during hospitalization (206.3 vs. 157.1 mg/dL). Patients with poorest control were less likely that the total population to have a high risk of mortality (11% vs. 15%) and severity of illness (13% vs. 18%). They also had less ICU care (8% vs. 13%), and a shorter LOS (5.82 vs. 7.82 days).

Predictive Modeling

The final multivariable logistic regression model had a c-statistic of 0.88. Model variables are detailed in Table 2 and rank ordered by standardized coefficient. The predictive performance was found to be robust when we examined the performance by splitting the data and running the model on a validation data set. The factor most predictive of glycemic control was HbA1c (OR, 0.60 [95% confidence interval {CI}, 0.58–0.61]), followed by admission blood glucose (OR, 0.91 [CI, 0.91–0.92]) and treatment with corticosteroids (OR, 0.06 [CI 0.04–0.08]). Other statistically significant predictive factors in the model included renal disease, BMI, risk for mortality, facility, major diagnostic category, liver disease, payor status, gender, cerebrovascular disease and COPD (see Table 2 for odds ratios). Additional analyses were conducted excluding variables potentially assessed after admission (insulin management, steroid use, and ICU) and possibly associated with the outcome. The results remained the consistent and we present the full final model here.

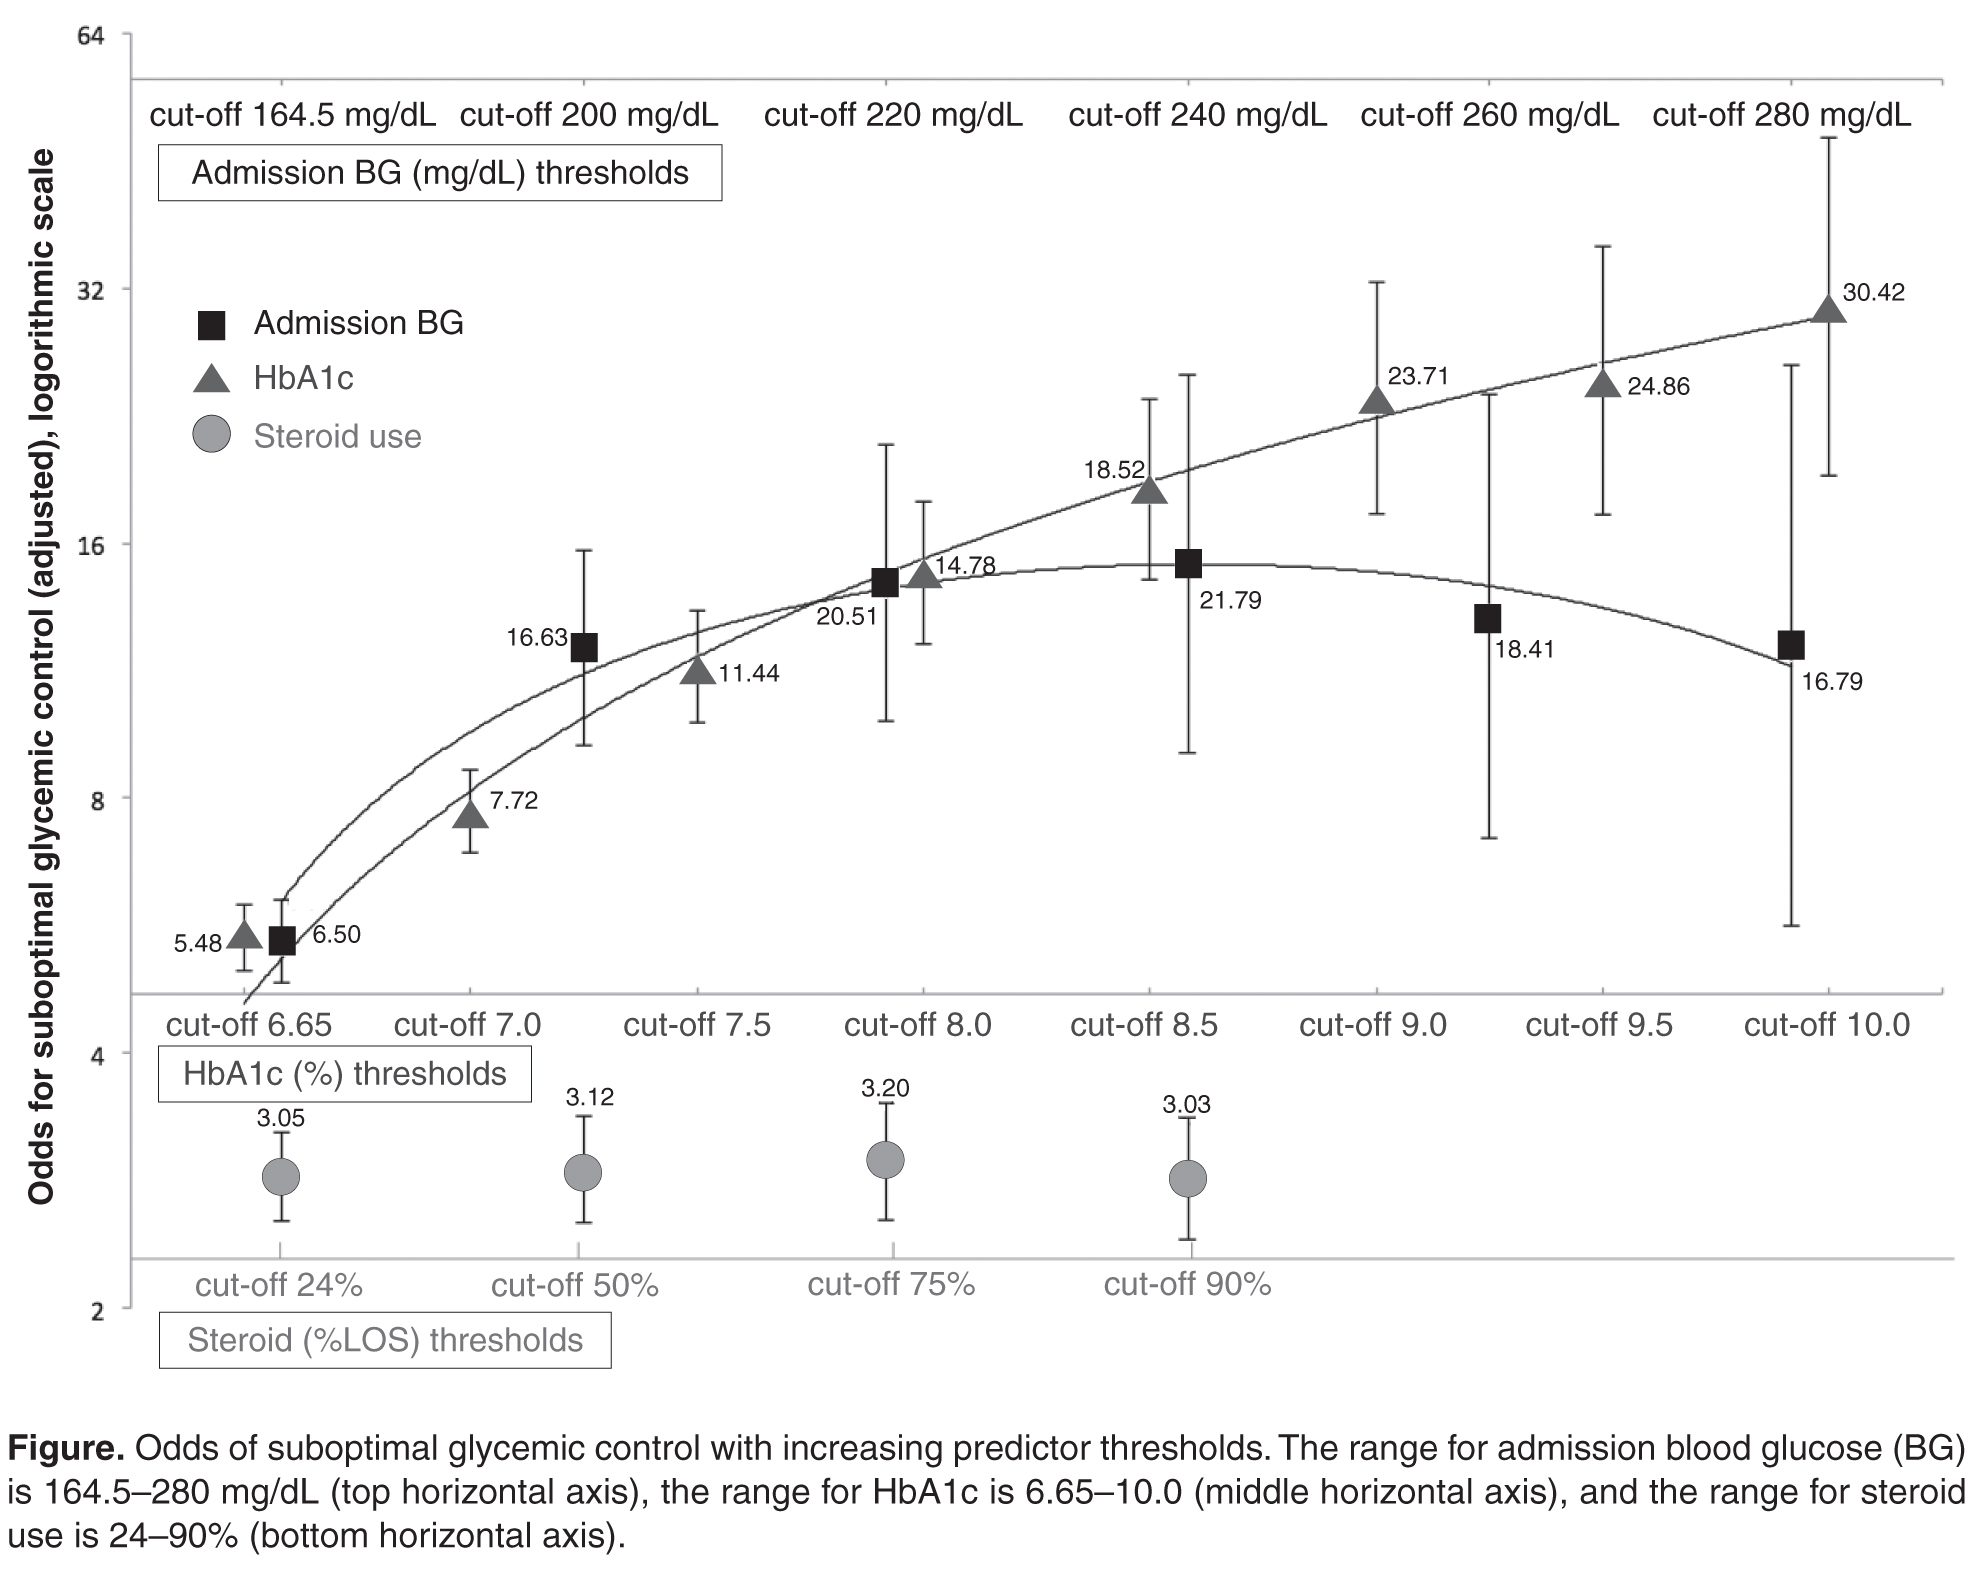
Classification tree analysis resulted in the same top 3 predictors, but in a different order. The analysis also provided cut-off values that predict suboptimal glycemic control. Classification tree analysis showed admission blood glucose was the most influential predictor, with 164.5 mg/dL indicating the optimal cut-point for prediction of SGC, followed by HbA1c with an optimal cut-off point of 6.65% indicating prediction of SGC, followed by treatment with corticosteroids, with an optimal cut-off point of 24% of the LOS on corticosteroids indicating prediction of SGC.

The Figure presents adjusted odds of good glycemic control calculated with a series of logistic regression models at different cut points of admission blood glucose, HbA1c, and treatment with corticosteroids, based on classification tree results. HbA1c had a strong linear relationship with SGC (R2= 0.99), with higher odds for SGC as HbA1c values increased. Admission blood glucose had a polynomial relationship with SGC (R2 = 0.95), with increasing odds for SGC as admission blood glucose values increased to approximately 240 mg/dL, above which the trend reversed. Steroid use showed no change in odds with increasing use during admission: a person on steroids for any length of time during admission had the same threefold increased odds for SGC.