Predictors of Suboptimal Glycemic Control for Hospitalized Patients with Diabetes: Targets for Clinical Action


Methods
A retrospective cohort study design was used to identify factors predictive of inpatient SGC for patients admitted to any of 3 hospitals aligned with Sharp HealthCare (“Sharp”), a community-based, nonprofit integrated health system headquartered in San Diego, California, that serves more than 27% of the county’s 3 million-plus residents each year.
Inclusion Criteria
We extracted data for 23,100 patients hospitalized between January 2009 and December 2012 with a secondary diagnosis of diabetes (types 1 and 2), a length of stay (LOS) ≥ 3 days, and a minimum of 2 point-of-care (POC) blood glucose tests per day. The LOS and blood glucose minimum are standard criteria for Sharp glycemic monitoring to ensure a minimum quantity of blood glucose monitoring for glycemic management.
Glycemic Control (Independent Variable)
Glycemic control was defined as POC blood glucose values within the target range of 70 to 180 mg/dL during hospitalization. POC tests outside that range were defined as SGC. This range was determined based on current Sharp benchmark targets and was not adjusted for total number of blood glucose values.
Predictive Variables
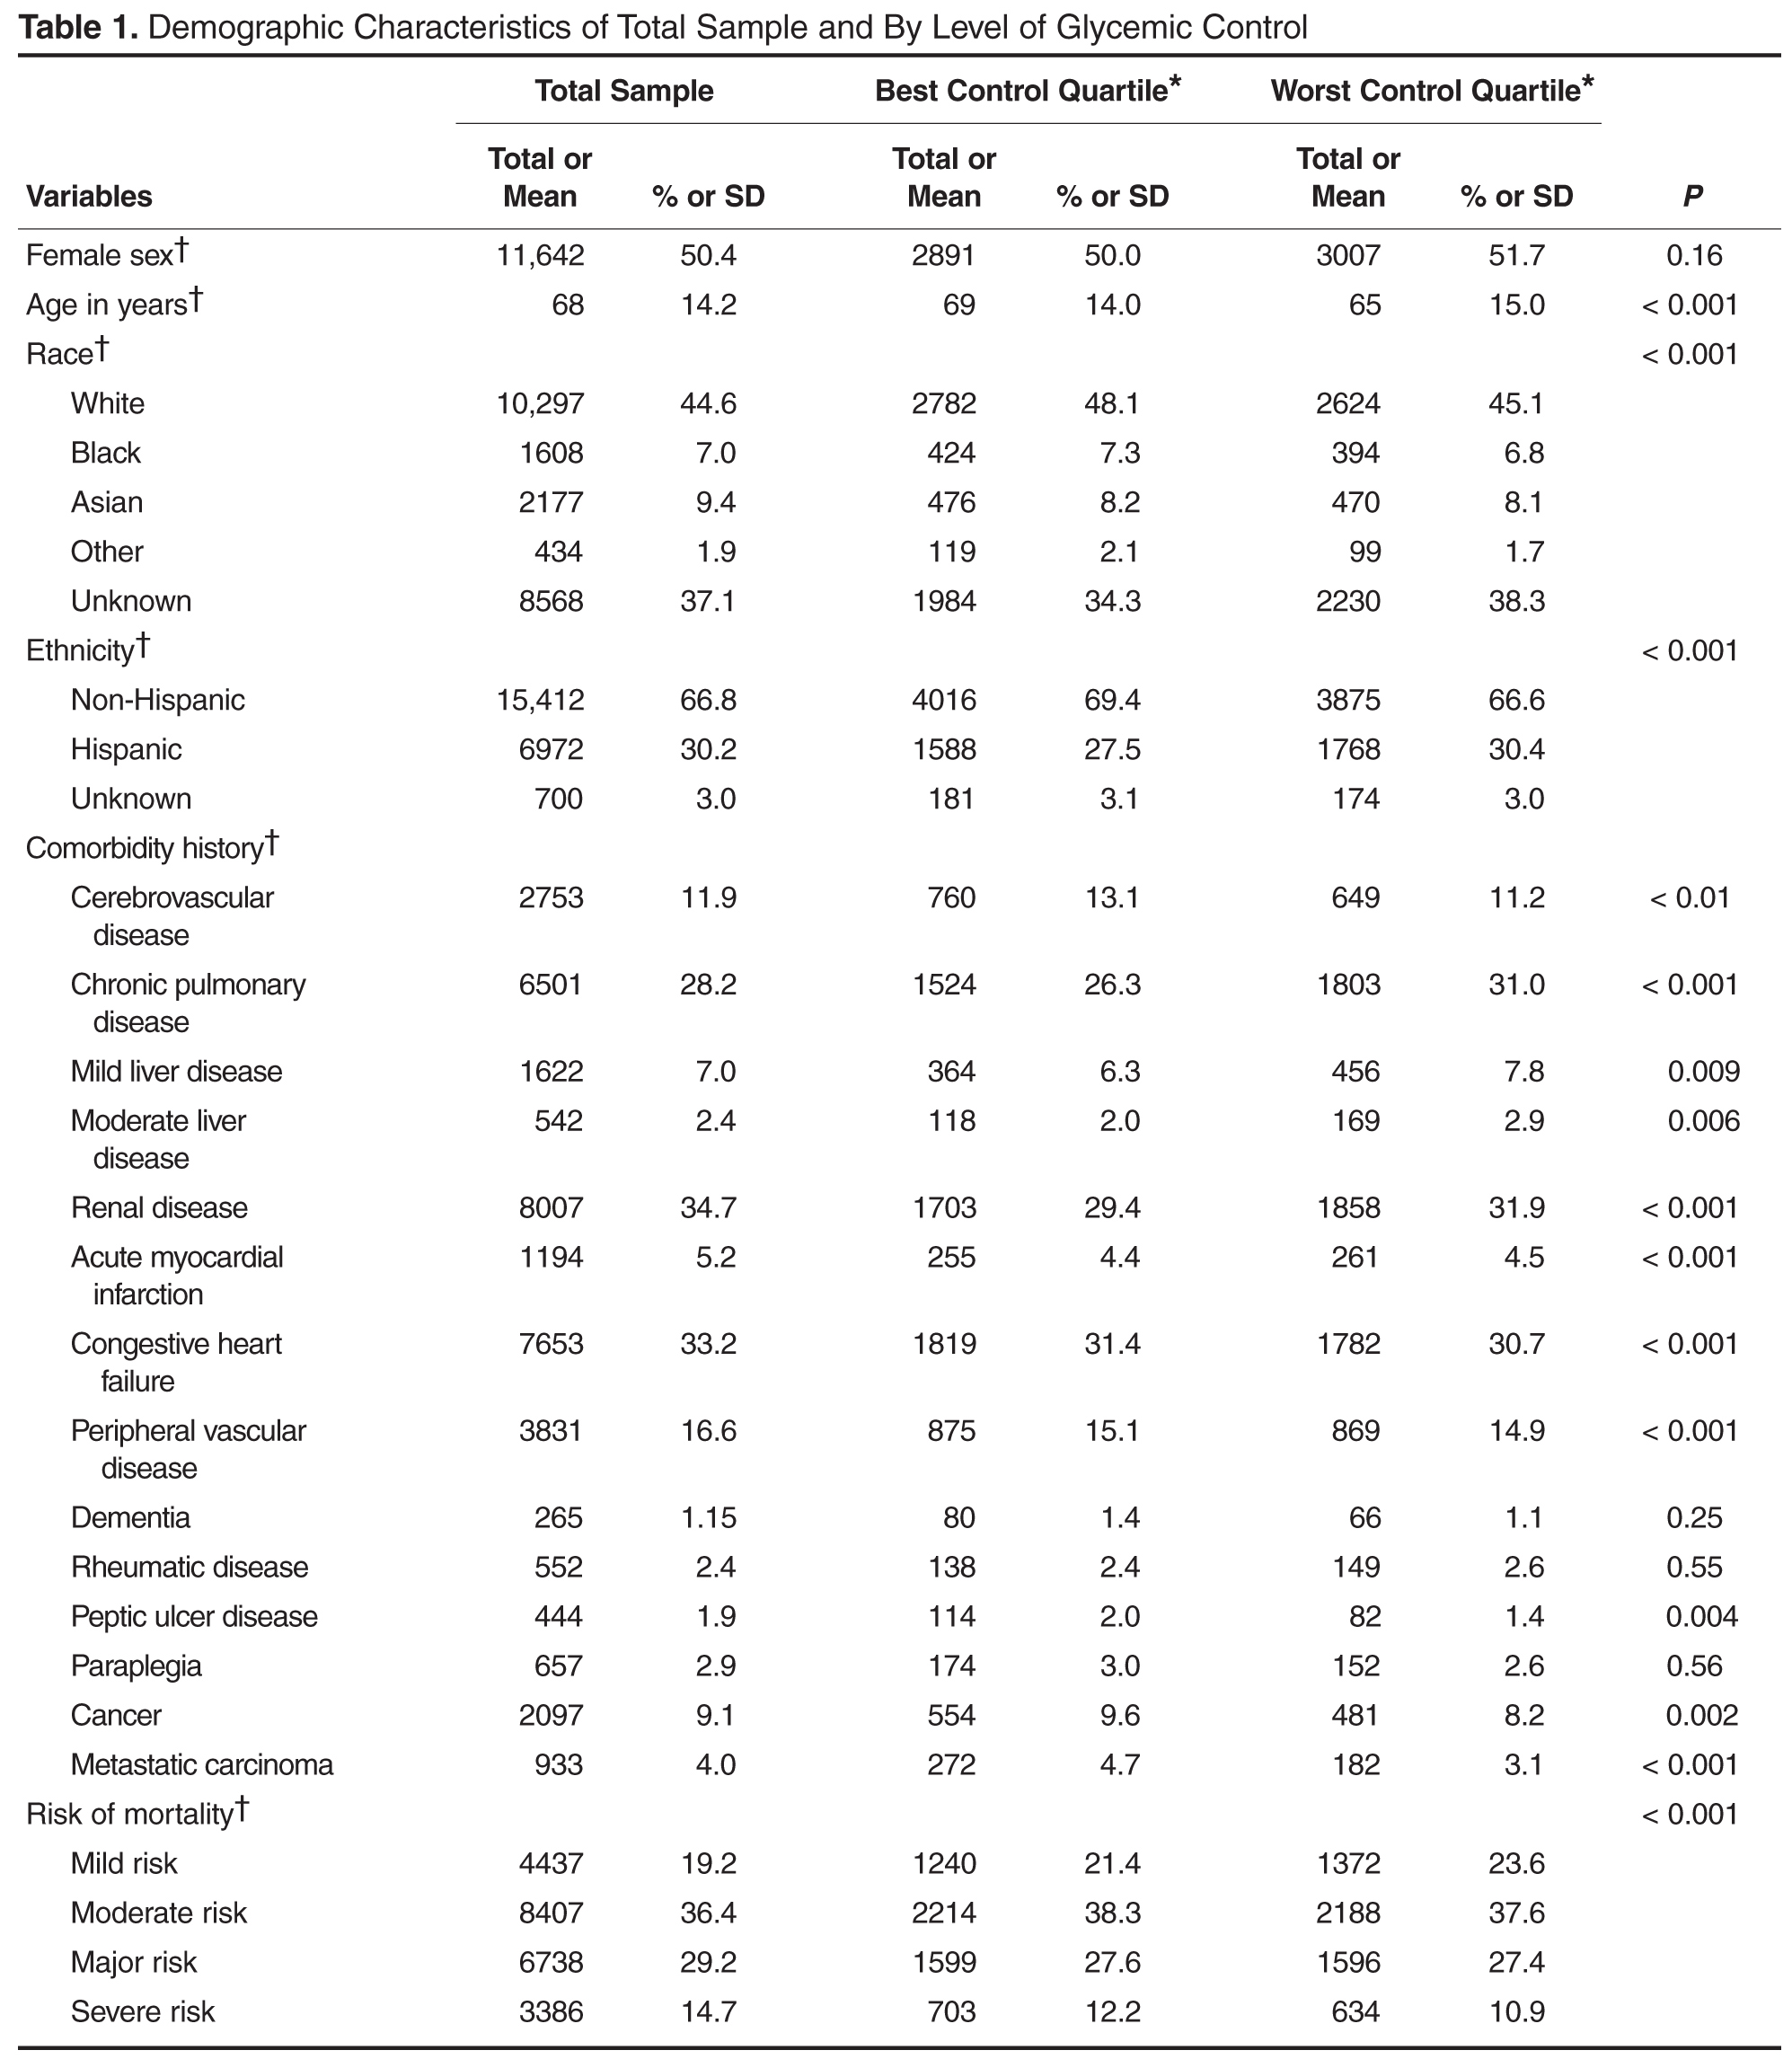
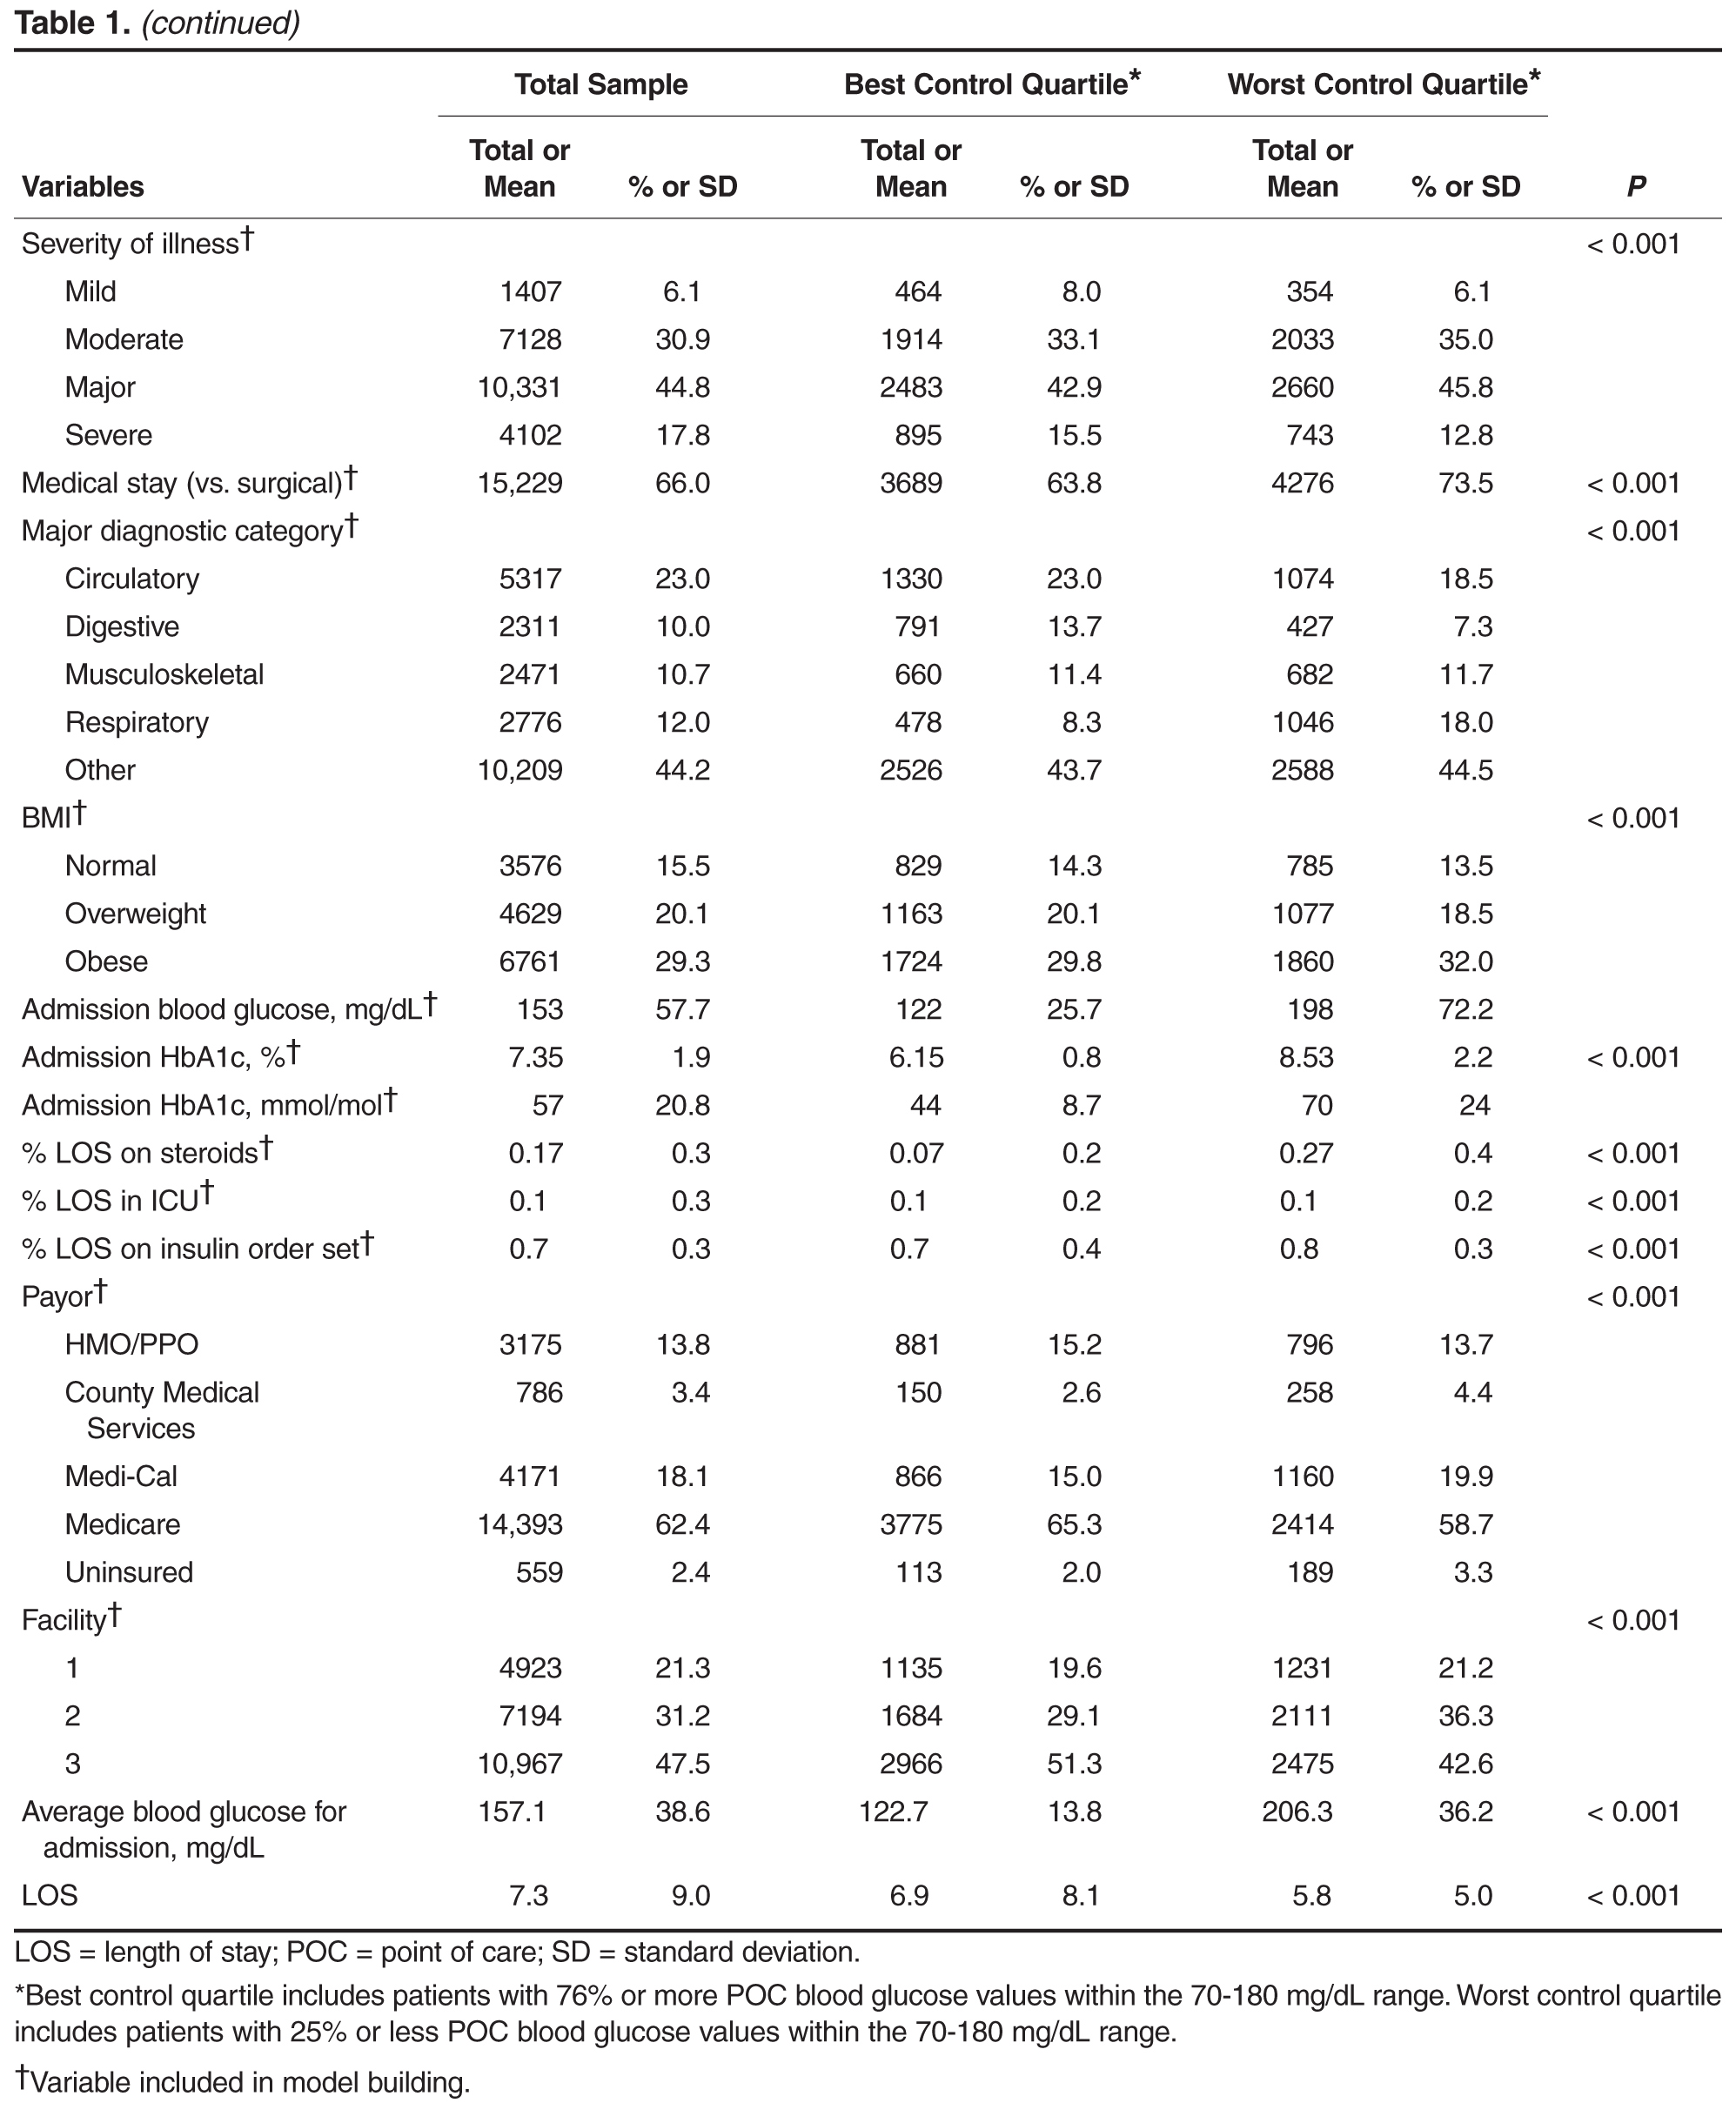
Age, gender, race, ethnicity, payor, facility and LOS were extracted from Sharp’s data warehouse. Medical vs. surgical stay and major diagnostic category was determined from administrative diagnosis coding. Body mass index (BMI) was extracted from Sharp’s electronic health record. Risk of mortality and severity of illness were calculated using 3M APR-DRG proprietary software using administrative diagnosis coding. Comorbidities were determined based on administrative diagnosis codes per published guidelines [11]. Glycosylated hemoglobin (HbA1c) was obtained on admission for patients with a secondary diagnosis of diabetes as part of Sharp's multidisciplinary diabetes care management program and extracted from the electronic health record. Admission blood glucose was defined as the first documented POC blood glucose after admission. ICU stay was calculated as a continuous variable: the percent of LOS spent in the ICU. Steroid use was similarly calculated, and defined as oral or intravenous administration of any quantity or dosage of the following corticosteroids during each day of hospitalization: dexamethasone, hydrocortisone, prednisone, and/or methylprednisone. Adherence to Sharp's multidisciplinary diabetes care management program was measured by use of standardized insulin order sets. Sharp uses evidence-based order sets for continuous infusion and subcutaneous insulin management; subcutaneous orders include basal and rapid-acting insulin. We calculated the total time a person was on an order set during hospitalization by subtracting any time a patient did not have insulin ordered from the total LOS. This was transformed into a variable documenting the percent of LOS the patient was on an insulin order set. Average blood glucose for admission was calculated for all documented POC blood glucoses during admission, omitting the admission blood glucose (the first POC blood glucose of the admission).
Analysis
Univariate analyses including t tests and chi-square tests were conducted to investigate the unadjusted association between variables and glycemic control. Good glycemic control was defined as 90% of all POC blood glucose tests between 70 and 180 mg/dL based on empirical distribution and organization targets. A predictive model of inpatient glycemic control was then developed using a backward stepwise multivariable logistic regression approach. The data were split into a model building and validation set. Variables were included that represented both baseline and transitional state during the hospital stay to account for potentially mediating effects and a sensitivity analysis was conducted with them in and out of the final model to assess impact. Standardized coefficients were calculated to rank order variables in the model allowing indication of the variables with the greatest predictive impact on the outcome. Further investigation of the optimal classification points for the variables was conducted to indicate best differentiation of good glycemic control. Significant variables from the multivariable logistic regression were included in an exploratory classification tree analysis that recursively partitioned data in order to improve the fit, with optimal splitting identified over all variables at all possible split points. Classification tree cut-off points were used to further develop models identifying odds ratios for various thresholds for the top three predictive variables. A series of logistic regression models were then run with differing cut points of top 3 predictors to isolate adjusted odds of good glycemic control. Analytic data set building and statistical analyses were completed using SAS 9.4.