An Automated Electronic Tool to Assess the Risk of 30-Day Readmission: Validation of Predictive Performance


Results
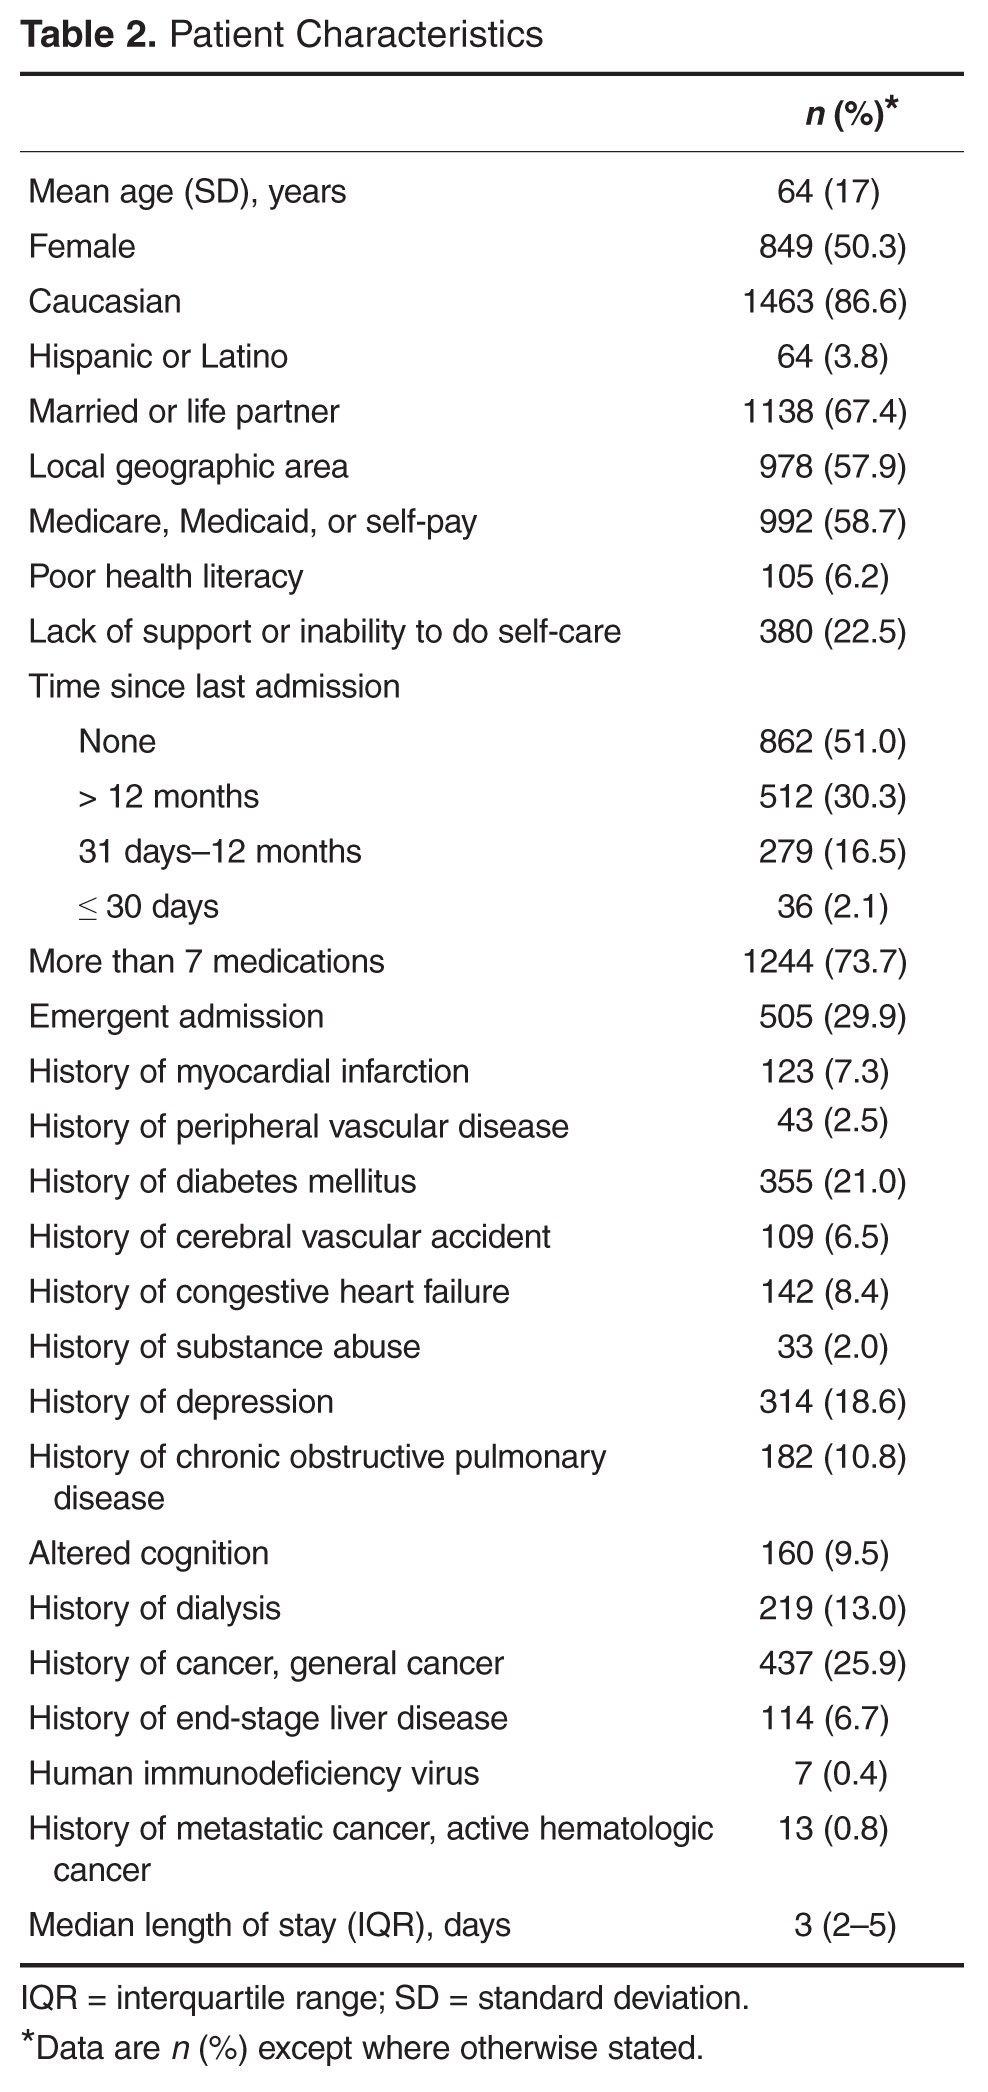
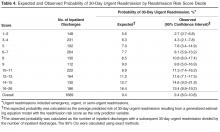
The RRS was significantly associated with 30-day urgent readmission (odds ratio [OR] for 1-point increase in the RRS, 1.07 [95% confidence interval {CI} 1.05–1.10]; P < 0.001). A c statistic of 0.612 (95% CI 0.570–0.655) indicates that the RRS has some ability to discriminate between those with and without a 30-day urgent readmission (Figure, Table 3). The expected and observed probabilities of 30-day urgent readmission were similar in each decile of the RRS. The calibration (Table 4) shows that although there is some deviation between the observed and expected probabilities, 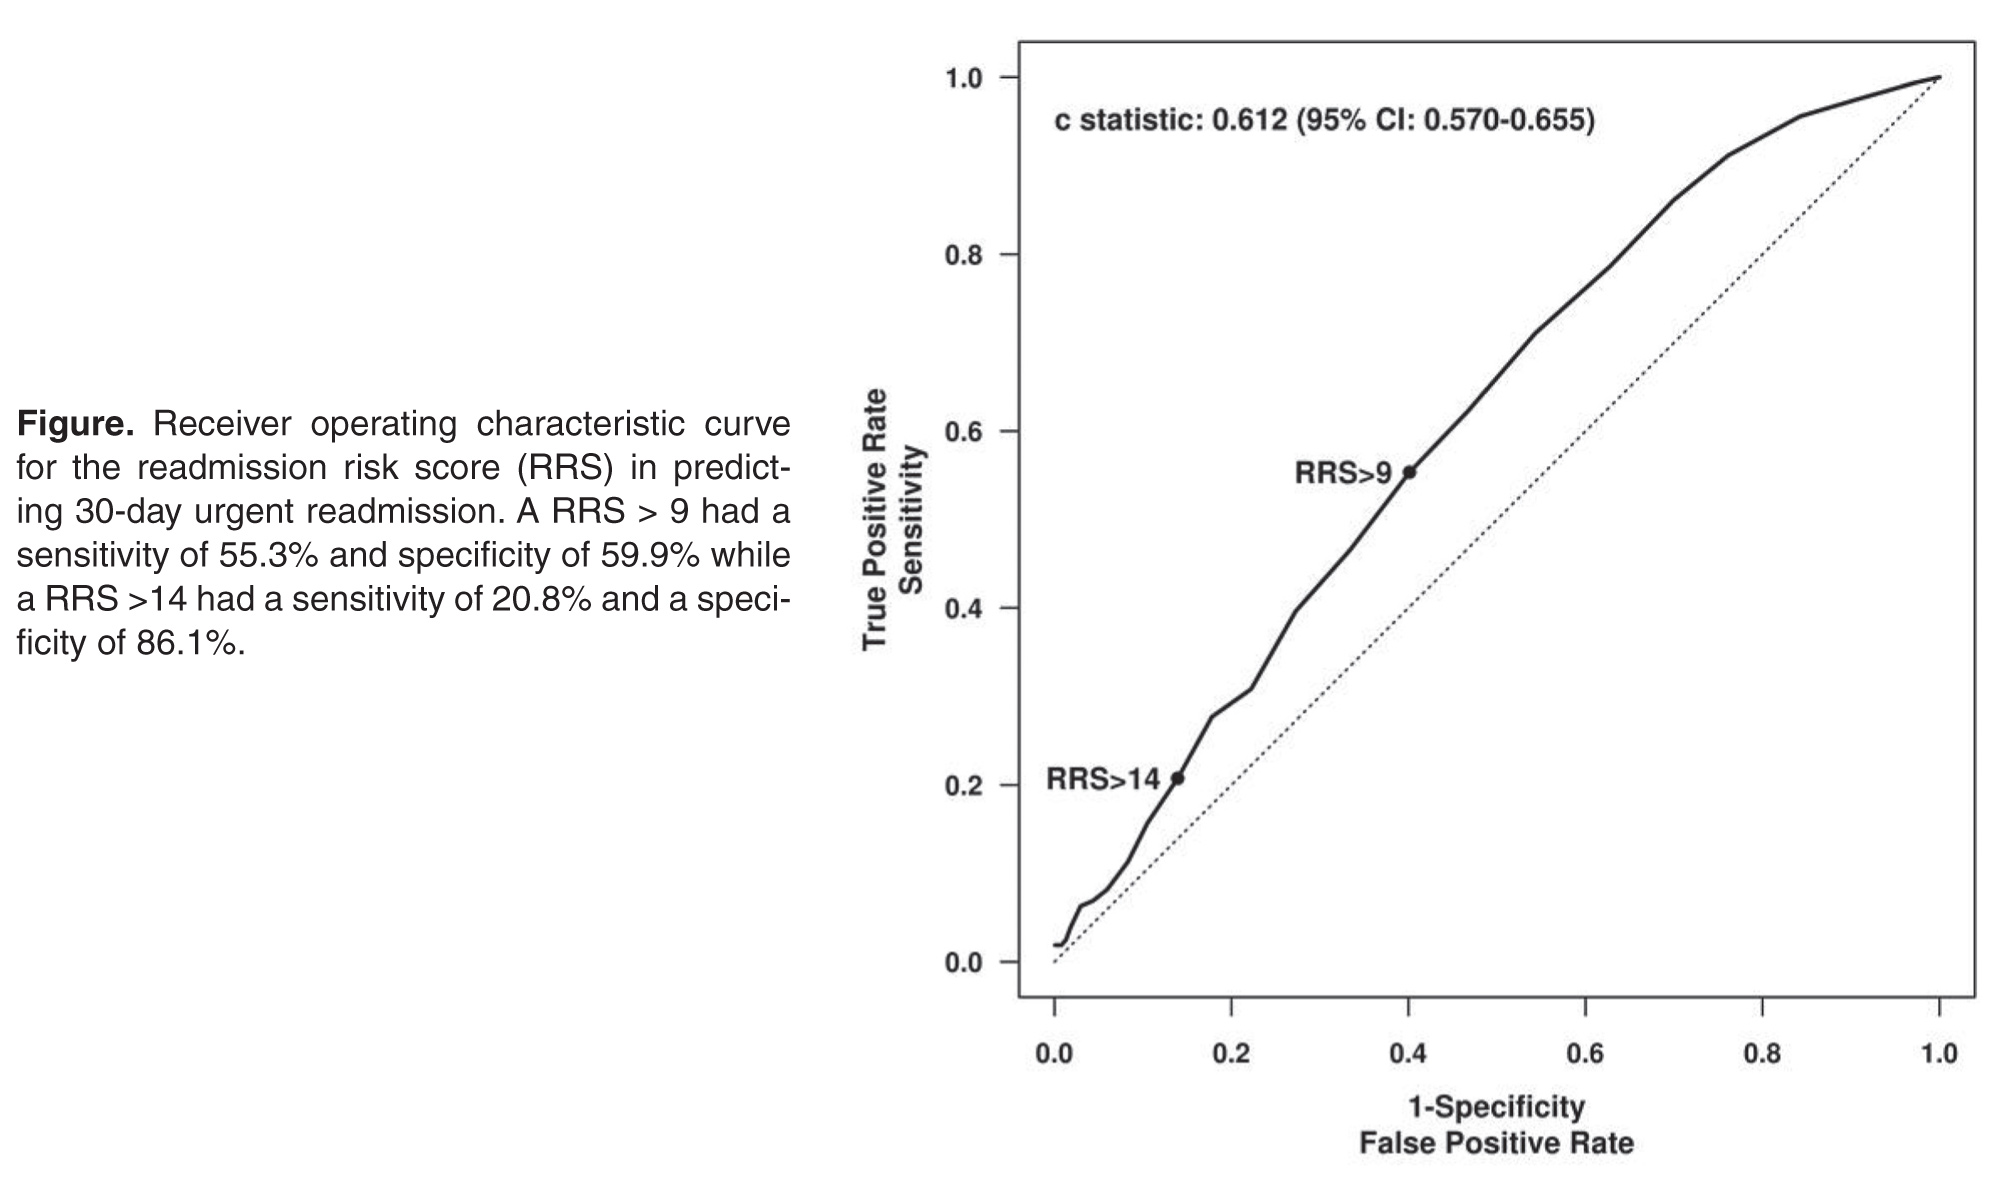
The RRS was also significantly associated with each of the secondary outcome measures. The odds ratios for a 1-point increase in the RRS for any 30-day readmission was 1.06 (95% CI 1.03–1.09, P < 0.001) and the c statistic was 0.591 (95% CI 0.551–0.631, Table 2). The odds ratios for a 1-point increase in the 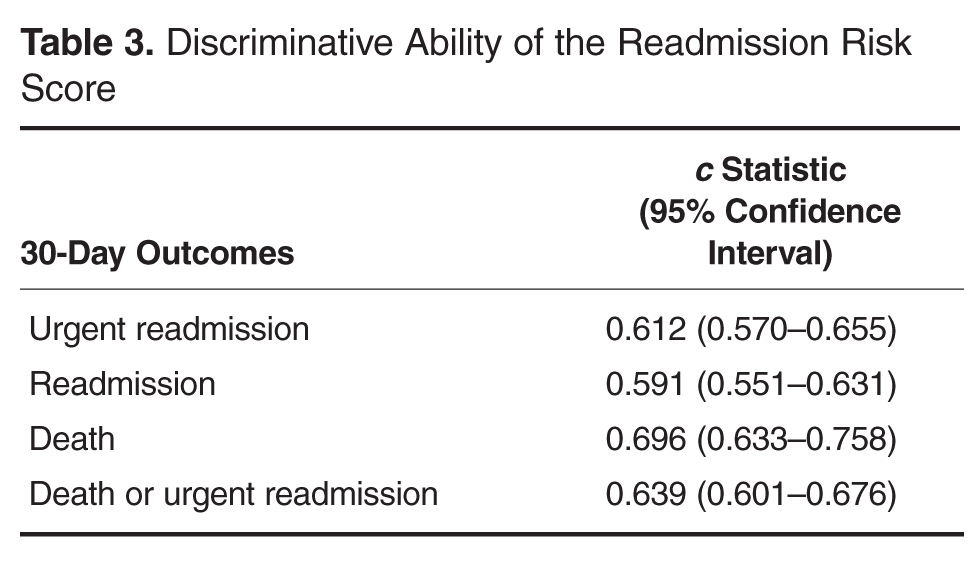
Discussion

Our study provides evidence that the RRS has some ability to discriminate between patients who did and did not have a 30-day urgent readmission (c statistic 0.612 [95% CI 0.570–0.655]). More importantly the calibration appears to be good particularly in the higher risk patients, which are the most crucial to identify in order to target interventions.
In addition to predicting the risk of readmission, our method of risk evaluation has several other advantages. First, the risk score is assigned to each patient within 24 to 48 hours of admission by using elements available at the time of, or soon after, admission. This early evaluation during the hospitalization identifies patients who could benefit from interventions throughout the stay that could help mitigate the risks and allow for a safer transition. Other studies have used elements available only at discharge, such as lab values and length of stay [7,11]. Donze et al used 7 elements in a validated scoring system, but several of the elements were discharge values and the risk assessment system had a fair discriminatory value with a c statistic of 0.71, similar to our results. The advantage to having the score available at admission is that several of the factors used to compose the RRS could be addressed during the hospitalization, including increased education for those with greater than 7 medications, intensive care management intervention for those with a lack of social support, and increased or modified education for those with low health literacy.
Second, the score is derived entirely from elements available in the EMR, thus the score is calculated automatically within 24 hours of admission and displayed in the chart for all providers to access. This eliminates any need for individual chart review or patient evaluation outside the normal admission process, making this system extremely efficient. Van Walraven et al [9] devised a scoring system using length of stay, acuity of admission, comorbidities and emergency department use (LACE index), with a validation c statistic of 0.684, which again is similar to our results. However, the LACE index uses the Charlson comorbidity index as a measure of patient comorbidity and this can be cumbersome to calculate in clinical practice. Having the score automatically available to all providers caring for the patient increases their awareness of the patient’s level of risk. Allaudeen and colleagues showed that providers are unable to intuitively predict those patients who are at high-risk for readmission [15]; therefore, an objective, readily available risk stratification is necessary to inform the providers.