
Accuracy of physical diagnostic tests for assessing ruptures of the anterior cruciate ligament: A meta-analysis


The summary estimates of sensitivity and specificity were used to calculate the predictive value of a positive (PV+) and negative test result (PV–) for circumstances with varying prevalences of ACL ruptures. When summary estimates of both sensitivity and specificity could not be calculated, the summary estimate of sensitivity and the accompanying specificity, estimated from the SROC curve, were used to calculate predictive values.
Results
Selection of studies
The literature search revealed a total of 1090 potentially eligible studies, 17 of which were selected.14-30 Two reports pertained to the same study,15,16 and 1 additional study was found by reference tracking.2 Thus, a total of 17 studies met the selection criteria.
Methodological quality and study characteristics
No study measured the index test (ie, the object of study) and reference standard independently (with blinding). Patients whose physical test results were abnormal were more likely to undergo the gold standard test—a factor that inflates sensitivity and decreases specificity. This verification bias was present in all but 2 studies.15,27 No study was performed in a primary care setting.
A detailed description of the characteristics and methodological quality of the 17 included studies is available online (Appendix B, Table W2-1, Table W2-2, Table W2-3, and Table W3).
Accuracy of ACL tests
Details of the process of selecting studies for further meta-analysis are presented online (Appendix C).
Diagnostic accuracy of the ACL tests is shown in Table 1. Significant heterogeneity of sensitivity and specificity was seen with all ACL tests, and no significant subgroups were detected for any of the tests. The power of metaregression analysis, however, was low due to the small number of available studies (4 to 6) and because some characteristics exhibited no variation.
Anterior drawer test. Correlation of sensitivity and specificity for the anterior drawer test was positive (6 studies); thus, no SROC curve was estimated. Sensitivity of the anterior drawer test was 0.18–0.92, and specificity 0.78–0.98. According to the bivariate random effects model, the pooled sensitivity was 0.62 (95% confidence interval [CI], 0.42–0.78) and the pooled specificity was 0.88 (95% CI, 0.83–0.92) ( Figure 1A ).
TABLE 1
Diagnostic accuracy of the anterior drawer sign, Lachman test, and pivot shift test
| First author | Type of ACL rupture | N | Prevalence | Sn | Sp | LR+ | LR– |
|---|---|---|---|---|---|---|---|
| Anterior drawer sign | |||||||
| Hardaker25 | Partial + complete | 132 | 0.77 | 0.18 | — | — | — |
| Tonino19*† | Partial + complete | 52 | 0.58 | 0.27 | 0.98 | 12.6 | 0.7 |
| Rubinstein28 | “ACL-deficient” | 39 | 0.23 | (0.76)§ | (0.86)§ | — | — |
| Boeree26* | Not specified | 203 | 0.29 | 0.56 | 0.92 | 6.7 | 0.5 |
| Lee21* | Not specified | 79 | 0.29 | 0.77 | 0.99 | 87.9 | 0.2 |
| Richter29* | Not specified | 74 | 0.78 | 0.67 | 0.88 | 5.4 | 0.4 |
| SteinbrÜck22* | Not specified | 300 | 0.17 | 0.92 | 0.91 | 10.4 | 0.1 |
| Sandberg18*‡ | Not specified | 182 | 0.68 | 0.39 | 0.78 | 1.7 | 0.8 |
| Lachman test | |||||||
| Hardaker25 | Partial + complete | 132 | 0.77 | 0.74 | — | — | — |
| Tonino19* | Partial + complete | 52 | 0.58 | 0.89 | 0.98 | 40.8 | 0.1 |
| Schwarz30*‡ | Partial + complete | 58 | 0.81 | 0.91 | 0.55 | 2.0 | 0.2 |
| Rubinstein28 | “ACL-deficient” | 39 | 0.23 | (0.96)§ | (1.00)§ | — | — |
| Boeree26* | Not specified | 203 | 0.29 | 0.63 | 0.90 | 6.5 | 0.4 |
| Lee21* | Not specified | 79 | 0.29 | 0.90 | 0.99 | 102.1 | 0.1 |
| Richter29*‡ | Not specified | 74 | 0.78 | 0.93 | 0.88 | 7.4 | 0.1 |
| SteinbrÜck22* | Not specified | 300 | 0.17 | 0.86 | 0.95 | 17.9 | 0.1 |
| Cooperman24 | Not specified | 32 | 0.41 | (0.65)║ | (0.42)║ | — | — |
| Pivot shift test | |||||||
| Hardaker25 | Partial + complete | 132 | 0.77 | 0.29 | — | — | — |
| Tonino19* | Partial + complete | 52 | 0.58 | 0.18 | 0.98 | 8.2 | 0.8 |
| Rubinstein28 | “ACL-deficient” | 39 | 0.23 | (0.93)§ | (0.89)§ | — | — |
| Boeree26* | Not specified | 203 | 0.29 | 0.31 | 0.97 | 8.8 | 0.7 |
| Richter29*†‡ | Not specified | 74 | 0.78 | 0.48 | 0.97 | 16.4 | 0.5 |
| SteinbrÜck22* | Not specified | 300 | 0.17 | 0.22 | 0.99 | 26.9 | 0.8 |
| * Study results used for meta-analysis | |||||||
| † 0.5 added to each cell of the 2x2 table | |||||||
| ‡ 2x2 table reconstructed | |||||||
| § Mean result of 5 orthopedic surgeons | |||||||
| ║ Sum of results of 2 physiotherapists | |||||||
| ACL, anterior cruciate ligament; Sn, sensitivity; Sp, specificity; LR+, positive likelihood ratio; LR–, negative likelihood ratio | |||||||
FIGURE 1
Sensitivity vs 1–specificity of the 3 tests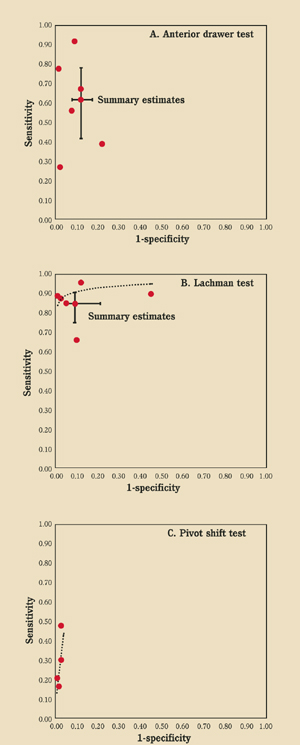
Scatterplots of sensitivity versus 1–specificity of A) the anterior drawer test (6 studies), B) the Lachman test (6 studies), and C) the pivot shift test (4 studies). Summary receiver operating characteristic curves and summary estimates of sensitivity and specificity (including 95% confidence intervals) are shown as appropriate.
Lachman test (Figure 2). The SROC curve of the Lachman test (6 studies) is shown in Figure 1B . Sensitivity ranged from 0.63 to 0.93, and specificity from 0.55 to 0.99. According to the bivariate random effects model the pooled sensitivity was 0.86 (95% CI, 0.76–0.92) and the pooled specificity was 0.91 (95% CI, 0.79–0.96).
Pivot shift test. The SROC curve of the pivot shift test (4 studies) is shown in Figure 1C . Sensitivity ranged from 0.18 to 0.48, and specificity from 0.97 to 0.99. Bivariate random effects pooling could not be performed; in this model 5 parameters must be estimated and only 4 studies were available.
Figure 3 shows the PV+ and PV– for all tests according to varying prevalences of ACL ruptures. The pivot shift test has the highest PV+ and the Lachman test the highest PV–. If the pivot shift test is positive, there is high probability of an ACL rupture, whereas a negative Lachman test rules out a rupture.
FIGURE 2
Lachman test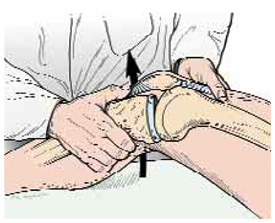
To perform the Lachman test, grasp the back of the proximal tibia posteriorly and place thumb over joint line anterolaterally. Pull the proximal tibia anteriorly and posteriorly, and compare sides for endpoint laxity.
FIGURE 3
Predictive value vs prevalence of positive and negative test results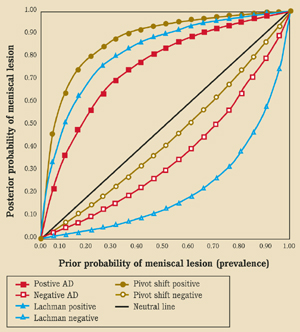
Predictive value (posttest probability of presence of ACL rupture) vs prevalence (prior probability of presence of ACL rupture) of positive and negative test results of the anterior drawer test (sensitivity=0.62, specificity=0.88), Lachman test (sensitivity=0.86, specificity=0.91), and the pivot shift test (sensitivity=0.32, specificity=0.98).
DISCUSSION
