You wrote the prescription, but will it get filled?


Nearly 16% of antihypertensive prescriptions in this study went unfilled. Managed care denials played a big part, but a third of the time patients didn’t pick up medications. E-prescribing feedback could help reverse these rates.
A reversed claim meant that the prescription had been approved by the MCO for coverage, but the approved claim was later reversed by the pharmacist when a patient failed to pick up the prescription within 14 days.
A denied or reversed claim meant that the patient did not receive the medication, and this occurrence was labeled as failure to fill.
For members in the cohort, a medical claims query identified hypertension using specific International Classification of Diseases, 9th Revision, Clinical Modification (ICD-9-CM) codes in the 401 category from July 1, 2006 through December 31, 2008. We deemed patients as newly diagnosed with hypertension if their first ICD-9-CM code for hypertension was within the preceding 6 months of the first antihypertensive prescription.
Outcome measures
The primary outcome measure was the percentage of new antihypertensive prescriptions that patients failed to obtain. To calculate this number, we designated the numerator as the number of denied or reversed claims for antihypertensive prescriptions, and the denominator as the overall number of antihypertensive prescriptions in the cohort.
The secondary outcome measure was the set of clinical and demographic factors related to failure to obtain the first fill. We evaluated the possible association of first-fill failure with age, sex, prior antihypertensive use, hypertension diagnosis, formulary status, co-payment, monotherapy vs combination product, pharmacologic category, type of health plan, and number of antihypertensive prescriptions.
All data collection conformed to patient privacy standards set by the Health Insurance Portability and Accountability Act (HIPAA), and the dataset was delivered to the researchers with de-identified patient information. The University of Maryland, Baltimore (UMB) Institutional Review Board (IRB) fully approved the research protocol.
Statistical analysis
Statistical analysis included descriptive statistics such as percentages for discrete variables (eg, sex) and calculations of means and standard deviations (SD) for continuous variables (eg, age). Univariate analyses examined the correlation between clinical/demographic characteristics and first-fill rates. We used binomial logistic regression to assess predictors of first-fill failure. We set statistical significance at an accepted alpha (P<.05).
Results
E-prescribing physicians
There were 1313 e-prescribing physicians ranked according to antihypertensive prescription volume. We contacted 457 physicians who prescribed the highest volume of medications and selected a final group of 164.
Patient/prescription cohort
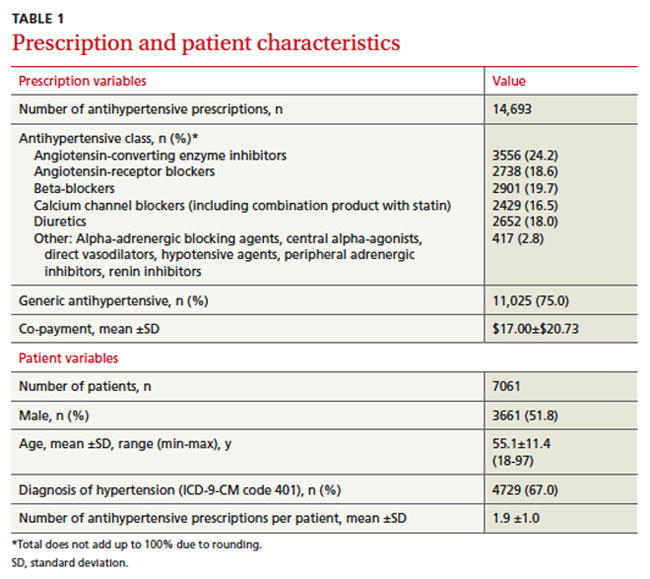
The cohort consisted of 14,693 antihypertensive prescriptions prescribed by the 164 e-prescribing physicians. There were 7061 unique members with a mean age of 55.1±11.4 years (TABLE 1). Half were men (51.8%), and each member had a mean of 1.9 antihypertensive prescriptions. About two-thirds had a diagnosis of hypertension, as represented by ICD-9-CM codes.
Three-fourths of the prescriptions were for generic antihypertensives. ACE inhibitors were the most commonly prescribed class of drug, at 24.2%, followed by beta-blockers, angiotensin-receptor blockers, diuretics, and calcium channel blockers. Agents not fitting into the above classes were prescribed the least, at 2.8% of prescription volume. The mean co-payment per antihypertensive prescription was $17.00±$20.73.
Primary outcome
Patients failed to obtain the antihypertensive medication for 2289/14,693 (15.6%) prescriptions. Of the prescriptions not obtained, 1466 (64%) were denied and 823 (36%) were reversed. Failure to obtain the 2289 prescriptions affected 24.3% (1713/7061) of patients.
Secondary outcome
We compared clinical and demographic characteristics between the 2 outcome groups (TABLE 2). Univariate analyses revealed statistically significant differences for age, history of antihypertensive use and hypertension diagnosis, formulary status, medication characteristics, and type of health plan. Patients prescribed a new antihypertensive product or receiving a new diagnosis of hypertension were significantly less likely to fill their prescriptions (P<.001). Prescriptions for brand and combination products were, respectively, 2.2 percentage points (P=.025) and 3 percentage points (P=.002) higher in the failure-to-obtain category than in the obtained category. The difference in mean co-payment was $2.56 higher in the failure-to-obtain group (P<.001). There were differences between the obtained and failure-to-obtain groups based on the member’s type of health plan (P<.001).
Statistically significant factors from univariate analyses were included in the logistic regression model (data not shown). Factors associated with failure to obtain an antihypertensive prescription fell into 3 categories: history of hypertension (new vs existing diagnosis), formulary status of antihypertensive agent, and type of health plan. Prescriptions for new antihypertensive products were 49.44 times more likely to go unfilled (P<.001). Prescriptions were 1.73 times more likely to remain unfilled for members with a new diagnosis for hypertension (P<.001). In addition, the formulary status of the prescription showed that prescriptions were less likely to be filled for brand products (P=.030) or for those requiring higher co-payments (P<.001). Compared with indemnity health plans, health maintenance organizations and preferred provider organizations were more likely to be associated with unfilled prescriptions (P<.001 and P=.044, respectively).