Can history and exam alone reliably predict pneumonia?


Trust your judgment (and your radiologist) when deciding whether to give antibiotics.
How did the prediction models do?
We applied the selected models to our data set; the results are shown in TABLE 2. Hopstaken II,5 which included an elevated CRP (≥20 mg/L), was the only model with a significant area under the curve of ROC (FIGURE).
Looking at the distribution of the scores on the regression equation of Hopstaken II,5 we observed that patients without pneumonia more often had a low score. For example, 29% of the patients without pneumonia had a score below –3, compared with 8% of the patients with pneumonia. Nine percent of the patients without pneumonia and 32% of the patients with pneumonia had a score above 0 (data not shown).
The model Hopstaken II showed a positive predictive value of 47% and negative predictive value of 84% (TABLE 2). The pretest probabilities for the presence and absence of pneumonia were 20% and 80%, respectively.
FIGURE
ROC curves: How did the predictive models do?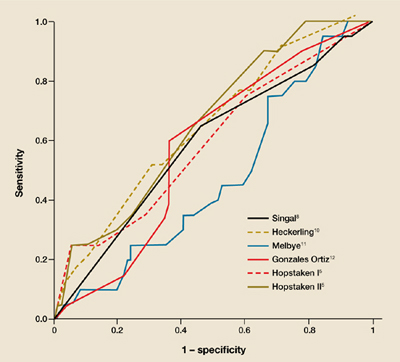
Tho ROC curves of the models as applied to the patients in this study. This graph plots the fraction of true positives vs the fraction of false positives (1 – specificity).
TABLE 2
Predictive values of the 6 models
| MODEL | ROC AREA (95% CI ) | ROC AREA (95% CI) AS GIVEN IN ARTICLES | POSITIVE PREDICTIVE VALUE (95% CI ) | NEGATIVE PREDICTIVE VALUE (95% CI ) | |
|---|---|---|---|---|---|
| Singal8 | 0.58 (0.45–0.70) | 0.75 (0.71–0.79) | —* | 80% (73%–87%) | |
| Heckerling10 | 0.63 (0.50–0.75) | 0.82 (0.78–0.86) | 24% (11%–38%) | 85% (77%–93%) | |
| Melbye11 | 0.49 (0.37–0.62)† | Not given | 17% (6%–36%) | 79% (70%–86%) | |
| González Ortiz12 | 0.57 (0.45–0.68) | 0.84 (CI not given) | 23% (15%–31%) | 88% (74%–100%) | |
| Hopstaken I5 | 0.62 (0.50–0.75) | 0.76 (CI not given) | 43% (17%–69%) | 83% (76%–90%) | |
| Hopstaken II5 | 0.69 (0.58–0.80)‡ | 0.80 (CI not given) | 47% (23%–71%) | 84% (77%–91%) | |
| The pretest probability for the presence of pneumonia was 20%; the pretest probability for the absence pneumonia was 80%. ROC, receiver operating characteristic; CI, confidence interval. | |||||
| * No patients had a value above the cutoff point for the regression equation of 0. | |||||
| † The cutoff point was set at 9.7. At this point 20.2% of the patients had pneumonia. | |||||
| ‡ P value <.05. | |||||
Discussion
History and physical exam cannot reliably predict pneumonia
The results of this study show that models only using medical history and physical examination do not reliably predict the presence of pneumonia compared with the gold standard: presence of a consolidation on chest radiograph. The model from the Hopstaken paper5 that used an elevated CRP in addition to the other information did better. However, this model’s predictive value for pneumonia was still limited. Given a population with a pretest probability of 20%, the post-test probability for a positive test result is 47%. The negative predictive value of this model is 84%, given a pretest probability of no pneumonia of 80%.
Addition of CRP improved the positive predictive value from 43% (Hopstaken I) to 47% (Hopstaken II).5 Several investigators18-21 have confirmed the value of CRP measurement in the diagnosis of infectious diseases. In our analyses to find predictive variables for the presence of pneumonia, we found a significant association for elevated CRP levels, as was shown by the results for the model Hopstaken II.5 However, this association is of limited value.
Limitations of this study
Possible bias in setting, inclusion criteria. Our study was conducted in a general practice setting in the Netherlands, as was Hopstaken.5 The studies by Singal,8 Heckering,10 and González Ortiz12 recruited patients from emergency departments in the US and Spain. In these countries, the organization of medical care is different from the Netherlands, and it is possible that the setting of the studies influenced the results. Note that only the predicting rule by Hopstaken, in general practice setting, shows significant results.
As a prerequisite for the inclusion of patients, we applied “abnormality on auscultation,” which had not been the case in other studies. González Ortiz12 used fever >38°C, and Hopstaken5 used cough as a prerequisite for inclusion; Singal8 and Heckering10 only included patients in whom a chest X-ray had been done. This could have introduced some selection bias. Although there were different inclusion criteria, all the patients were suspected of having LRTI. It is unclear how these differences in inclusion criteria may have influenced the results.
Radiography may have missed cases. Chest radiography was used as the standard reference to confirm the diagnosis of pneumonia because of its low cost and general accessibility. However, the reliability of this test is debated. In this study, chest radiographs were reviewed by several radiologists to increase the reliability of the diagnosis. The chest radiographs were taken about 5 to 7 days after inclusion in the study, which was 2 weeks after onset of symptoms on average.