EHR use and patient satisfaction: What we learned


In this study, how much time a physician spent looking at the patient predicted greater patient satisfaction. Overall, however, patients were highly satisfied with their physicians despite high EHR usage.
Study design and sample
The study participants were clinicians in 4 VAMC community clinics located in San Diego, Calif. Twenty-three clinicians (21 general internal medicine physicians and 2 nurse practitioners) were enrolled in the study. Most clinicians identified 5 to 6 patients from their practices to participate in the study (2 participants identified only one patient each). All patients were visiting their clinician for either an acute visit or a follow-up visit.
Although there were slight variations in clinic room size and shape, all rooms were equipped with a compact desk against a wall, a rolling desk chair, a desktop computer with keyboard and mouse, and a second, fixed chair placed diagonal to the physician’s chair. Two rooms had dual monitors. There was a standard examination table in all examination rooms.
The clinicians’ computer use and the patient-clinician interactions in the exam room were captured in real time via video recordings of the interactions and the computer screen. A usability testing software system (Morae) was used to record clinicians’ computer activities, including mouse clicks and scrolls on the computer. The Computerized Patient Records System (CPRS) was the EHR used by all clinicians in this study.
At the end of the visit, patients were asked to complete a satisfaction survey with questions in 3 domains: the physician’s engagement in patient-centered communication, the physician’s clinical skills, and the physician’s interpersonal skills.
Data analysis
Descriptive statistics were used to document patient characteristics, the clinicians’ EHR usage (total number of mouse clicks and scrolls during the visit) and interaction with the patient (gaze time at EHR vs at patient and companion), and to summarize patient satisfaction with the visit. To account for clinician cluster effect, a linear mixed effects model was used to assess the associations between patient satisfaction with the clinician and 2 variables: the amount of clinician time spent viewing or using the computer and the clinician time spent interacting with the patient.
We also assessed the above associations by controlling for visit length. Visit lengths not significant at P<.10 were reported as unadjusted analyses.
All analyses were performed using R statistical software, with a P value of <.05 interpreted as statistically significant.
RESULTS
Satisfaction surveys and video and Morae data were collected for 126 individual patient office visits to the 23 participating physicians and nurses. A majority of the patients who participated in the study were older (mean: 60.5 years; standard deviation [SD]=13.4 years), male as expected in a VA setting (96.8%), Caucasian (65.1%), and had at least some college education (81.7%, TABLE 1).
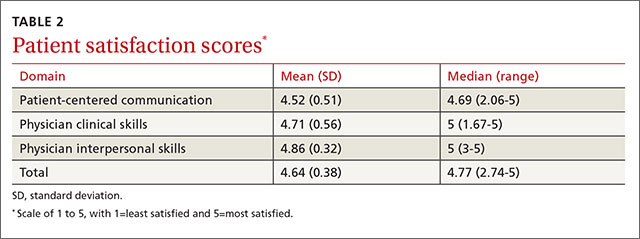
Patients rated their satisfaction in 3 domains—patient-centered communication, physician clinical skills, and physician interpersonal skills—using a 1 to 5 scale (1=least satisfied, 5=most satisfied). Patients in this study were highly satisfied with their physician or nurse in all 3 domains and overall (TABLE 2), with an average satisfaction score of 4.52 ± 0.51 for patient-centered communication, 4.71 ± 0.56 for physician clinical skills, 4.86 ± 0.32 for physician interpersonal skills, and 4.64 ± 0.38 for total satisfaction.
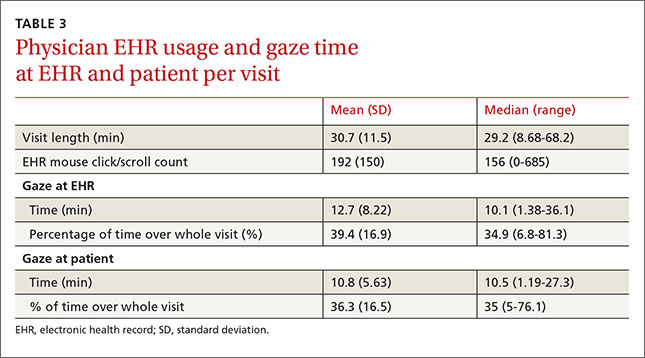
The physicians and nurses used their EHR system extensively during the visits as delineated by the number of clicks and scrolls on the computer. The average number of clicks and scrolls was 192, with a maximum of 685 clicks and scrolls during one visit. The average visit lasted 30.7 minutes, and on average the clinician spent 12.7 minutes (SD: 8.22 minutes), or an average of about 39.4% of total visit time, viewing or working on the EHR; an average of 10.8 minutes (SD: 5.63 minutes), or an average of about 36.3% of total visit time, was spent interacting with the patient (TABLE 3).
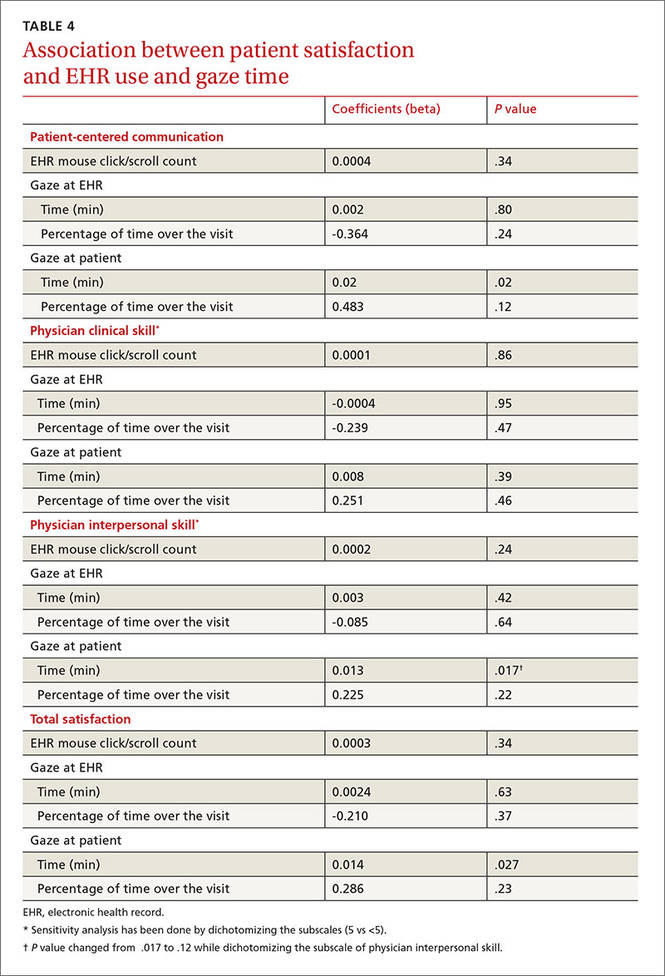
Without adjusting for visit length, patient satisfaction with the clinicians’ patientcentered communication (beta=0.02; P=.02) and total satisfaction (beta=0.014; P=.027) were significantly associated with clinicians’ gaze time at the patient; more clinician gaze time at the patient resulted in greater patient satisfaction (TABLE 4). Adding visit length to the above models had no significant effect (P>.10); therefore, we did not include it in the models.
Patient satisfaction with clinicians’ interpersonal skills was positively associated with gaze time at the patient (beta=0.013, P =.017) without adjusting for visit length. Since the normal assumption of residuals was not plausible based on a normal probability plot, we also assessed the association by dichotomizing the score (5=very satisfied vs <5=not very satisfied) and this significance disappeared. This association was not significant while controlling for visit length.
The percentage of gaze time at the patient (the fraction of patient gaze time over the entire visit) was not significantly associated with patient-centered communication (beta=0.483, P=.12, TABLE 4) when not adjusted for visit length. After adjusting for visit length (P=.052), the association became significant (beta=0.628, P=.033); thus, the higher percentage of time the clinician spent interacting with the patient, the more satisfied the patient was.