Improving Patient Satisfaction in Dermatology: A Prospective Study of an Urban Dermatology Clinic


Patient satisfaction has become an important measure of quality under the Patient Protection and Affordable Care Act. In this study, we assessed and analyzed patient satisfaction, nonattendance rates, and cycle times in an outpatient dermatology clinic. This study provides a snapshot of patient satisfaction in an urban dermatology clinic. Under the Patient Protection and Affordable Care Act, providers will be challenged to increase access to care and to validate quality of care through patient satisfaction.
Practice Points
- Patient experience can be measured through brief point-of-service patient satisfaction questionnaires.
- Stratifying and analyzing patient satisfaction allows for targeted interventions to be developed and implemented.
- Educational handouts in the patient's primary language may help increase satisfaction and improve compliance.
Results
Of the 298 participants surveyed, the average age was 49 years, 51% were male, 73% self-identified as Hispanic/Latino, 64% spoke Spanish, 58% had a high school diploma or lower, and 68% reported an annual household income of less than $15,000 (Table 1).
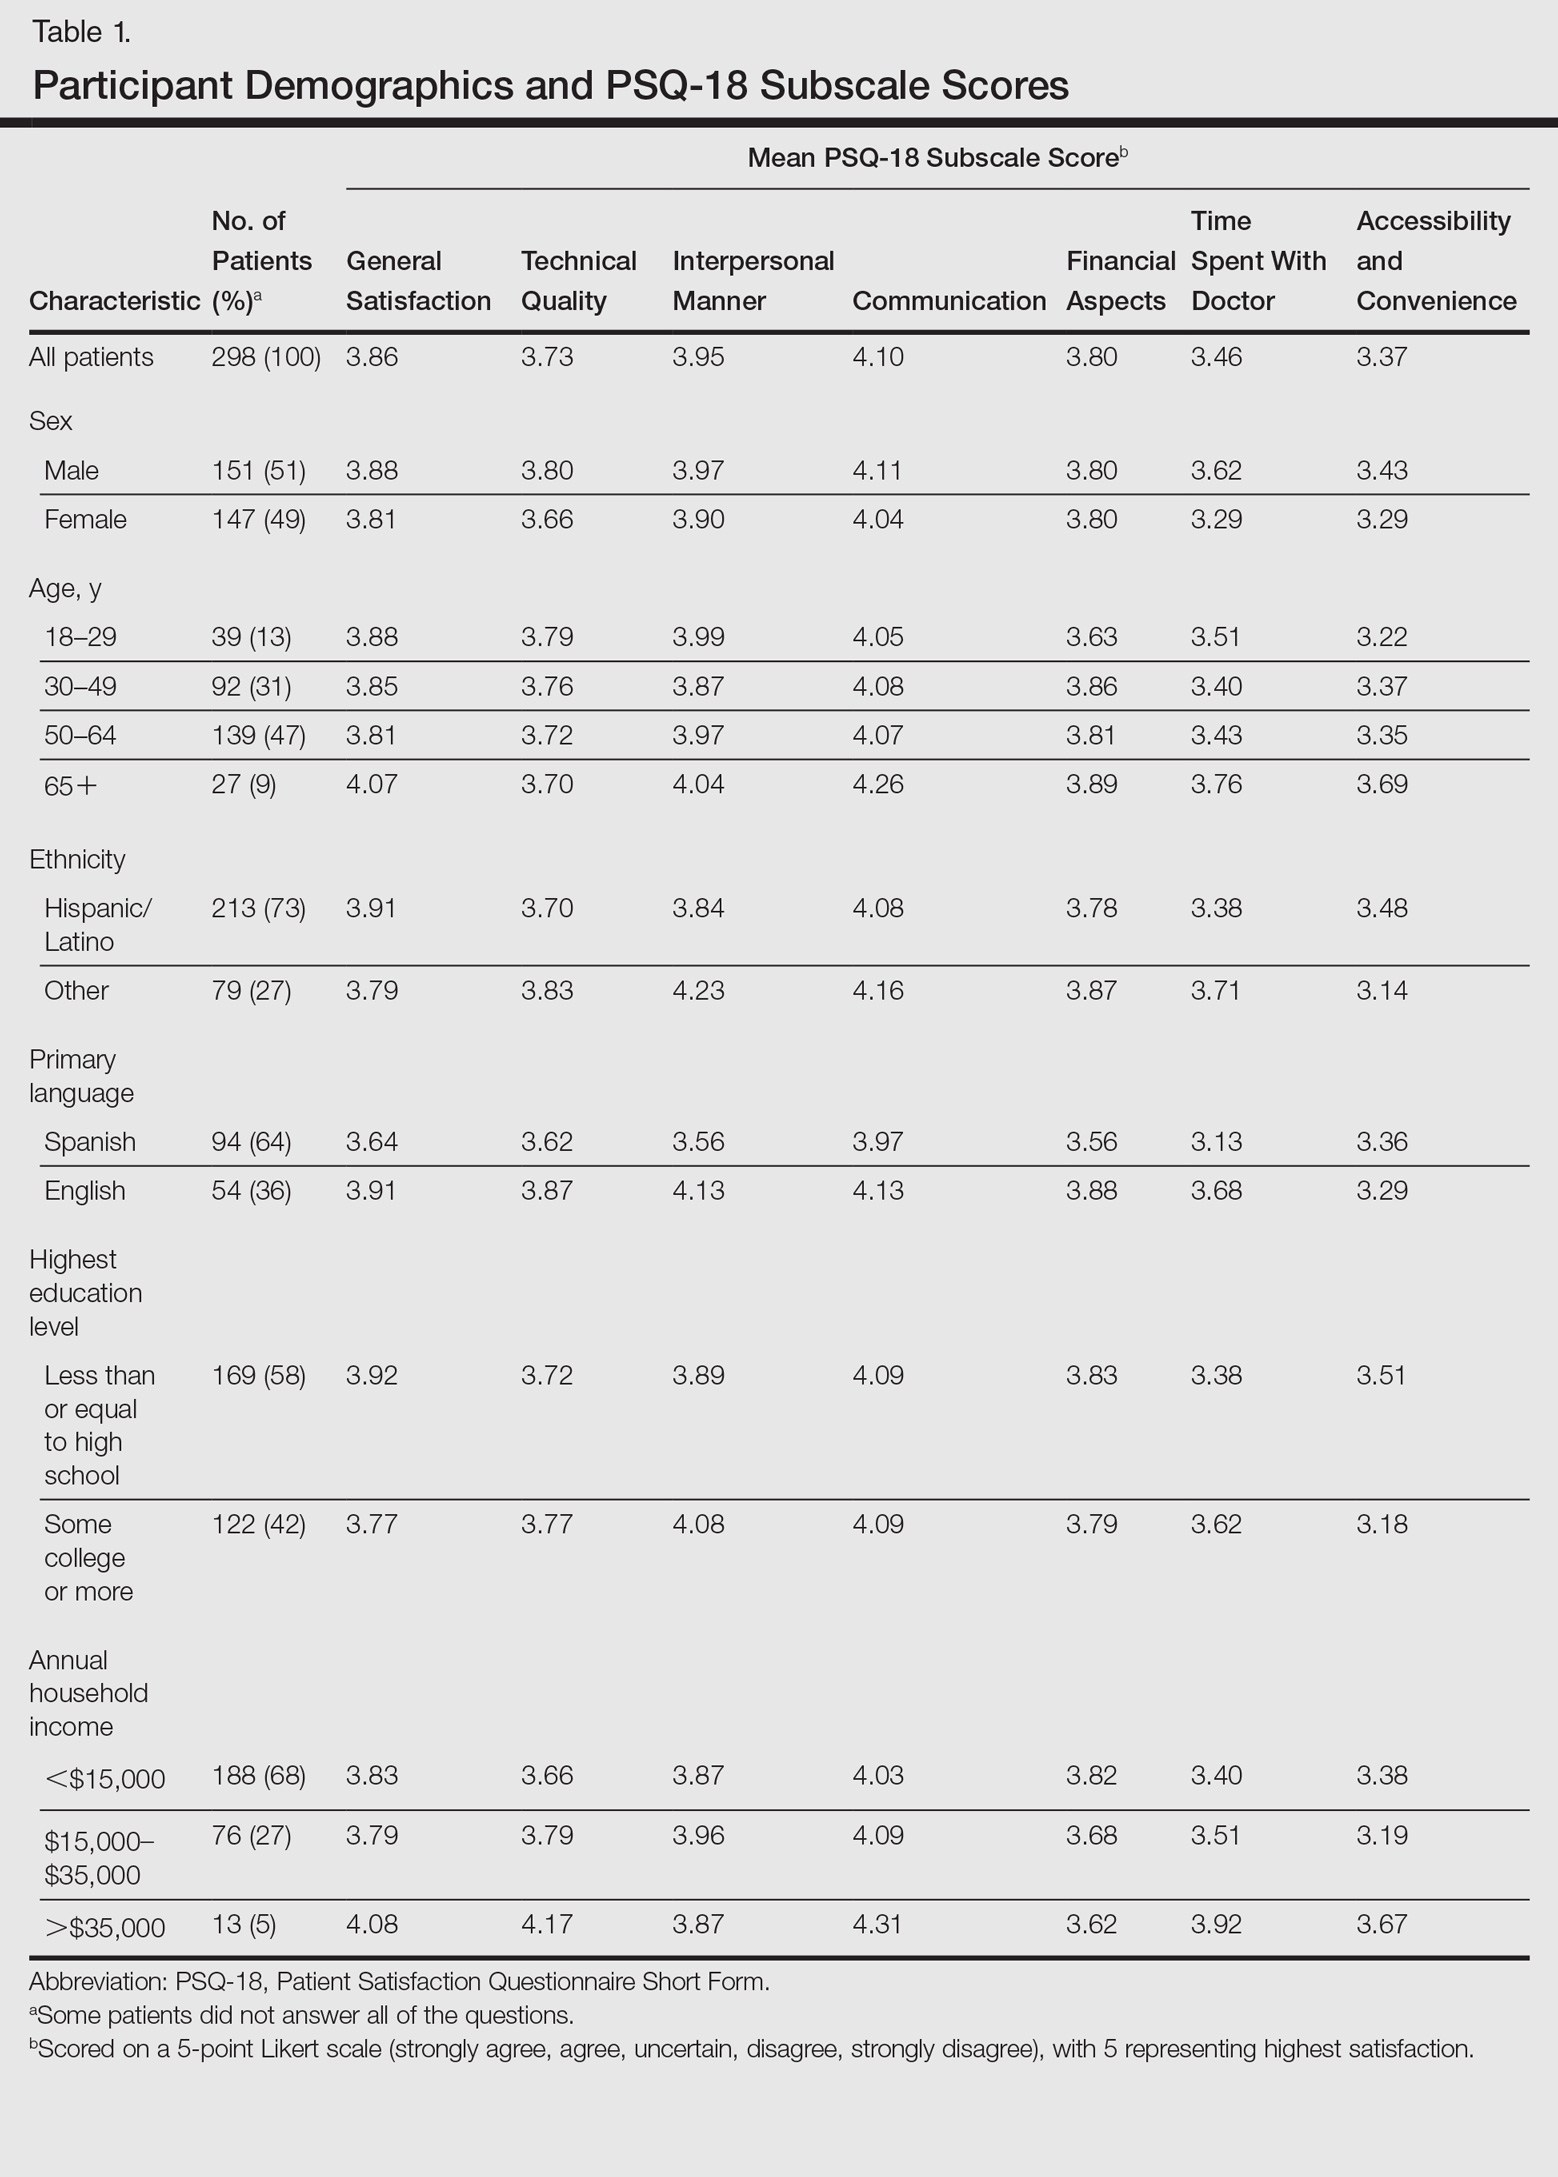
Table 1 shows PSQ-18 scores for all patients stratified by demographics. Notably, patients with some college or more were significantly more satisfied on the interpersonal manner (P<.03) and time spent with doctor (P<.007) subscales when compared to those who were less educated, but they had lower general satisfaction scores (P<.001). Patients with a reported annual household income of greater than $35,000 were more satisfied on the technical quality (P<.07) and time spent with doctor (P<.04) subscales when compared to those making less than $15,000. The patients with a household income greater than $35,000 also were more satisfied with accessibility and convenience (P<.05) than those making $15,000 to $35,000. When stratified by sex, the time spent with doctor subscale was significantly higher in males than females (P<.001). (Statistically significant differences when stratifying by age, ethnicity, and language are noted in the “Comment” section.)
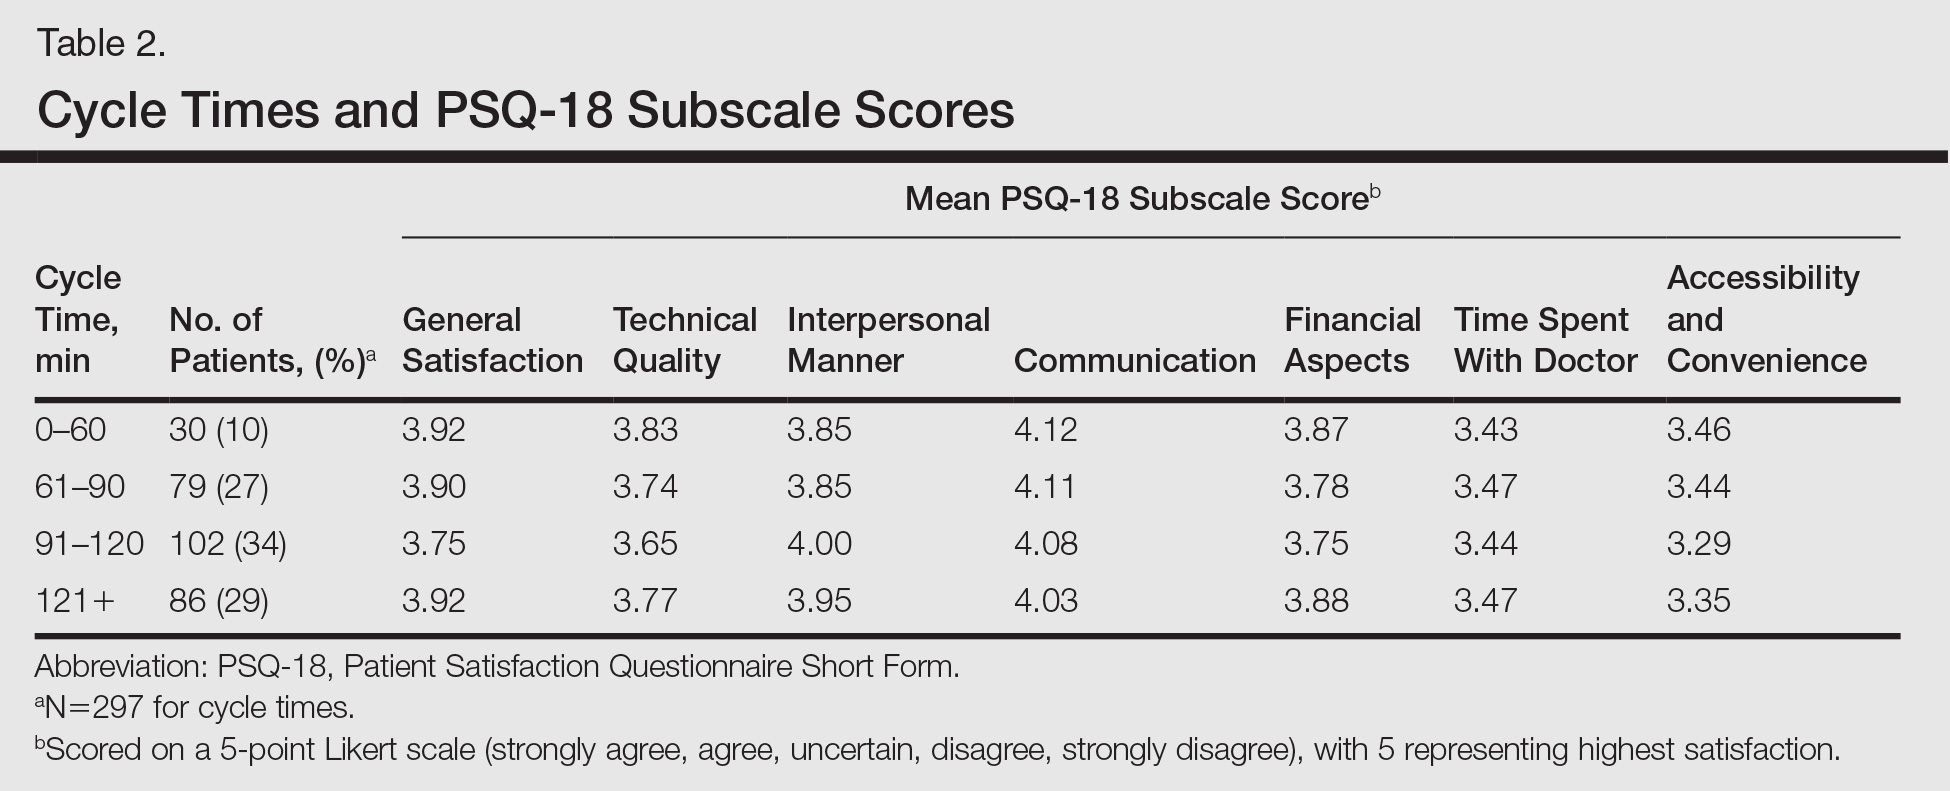
,Patients’ average cycle time from check in to checkout was 102 minutes (range, 24–177 minutes). There was no statistically significant difference in patient satisfaction subscale scores when stratifying patients by cycle time. During a period comparable to the time that surveys were collected, our mean (standard deviation [SD]) nonattendance rate was 30% (7%). Therefore, based on 2 SDs, there was a 95% chance that 16% to 44% of patients would not attend their scheduled appointments in each clinic.
Comment
Our dermatology clinic received an average general satisfaction subscale score of 3.86. Although the general impression of patients was positive, there were subscale scores in which the clinic performed below the general satisfaction score; the 2 lowest were time spent with doctor (3.46), and accessibility and convenience (3.37). One possible explanation for the lower time spent with doctor subscale score relates to visiting an academic medical center. Patients often are seen sequentially by a medical student, resident, and supervising physician. This educational model contributes to long cycle times; indeed, average patient visit length was more than 1.5 hours in our study. Meanwhile, patients may consider their “doctor” to be the last member of the medical team they see; thus, the percentage of the clinic visit time that a supervising physician spends with the patient may be perceived by patients as short compared to the overall time spent in the clinic.
Surprisingly, there was no statistically significant difference in patient satisfaction subscale scores, including time spent with doctor, for patients with longer cycle times compared to short cycle times (Table 2), which suggests that the length of clinic visits may have been longer than the threshold for further effect on satisfaction scores. To this point, prior research has shown that patient satisfaction notably drops after 15 minutes of waiting,5 defined as the time from check in to when the patient first sees the provider. Our data set did not allow us to analyze wait time by that definition. However, we used cycle time, which includes various periods of waiting during the patient’s visit. If we had more data points on cycle times less than 30 minutes, we might have detected a clearer relationship of cycle times to patient satisfaction scores.
Satisfaction may not have varied with longer cycle times because differing perceptions might have balanced each other; in some cases, longer cycle times might reflect additional time spent with the provider, which could be perceived as valuable by the patient, and for others the long cycle time might be dissatisfying. Nevertheless, many of our patients were familiar with the county health system and expected to spend 90 minutes or more in clinic for each visit. Regardless, newly insured patients may have different expectations on how their health care should be delivered, an issue that could be investigated in the future.
The accessibility and convenience subscale scores reflected patients’ perception of timeliness and availability of medical care. The way that patients are scheduled at our clinic likely affected this subscale score, as patients must be referred through their primary care provider or the emergency department. We believe that many patients consider the wait for a primary care appointment as part of the overall wait for a dermatology appointment, which affects perception of accessibility and convenience for our clinic.
When we stratified by age, ethnicity, and language, other interesting trends occurred in satisfaction scores. Patients older than 65 years had a statistically significant higher accessibility and convenience subscale score when compared to the groups aged 18 to 29 years (P<.02) and 50 to 64 years (P<.05) as well as a higher but not statistically significant score compared to those aged 30 to 49 years (P<.07). Possible explanations include that older patients are familiar with the workings of our health system or that some of our patients older than 65 years may be retired and have fewer daily obligations. For the time spent with doctor subscale score, patients older than 65 years had higher scores when compared to those aged 30 to 49 years (P<.06) and 50 to 64 years (P<.07), perhaps because providers are spending more time with older individuals who may have more medical issues. A study involving a family medicine clinic also found that older patients were more satisfied with their overall care,6 which may be important given the changing demographics of Americans seeking medical care.
Differences in patient satisfaction when our patients were stratified by primary language and self-identified ethnicity also were noted. English-speaking patients were significantly more satisfied than Spanish-speaking patients in 4 subscales of satisfaction: technical quality (P<.01), interpersonal manner (P<.0001), financial aspects (P<.02), and time spent with doctor (P<.0006). For ethnicity, non-Hispanic/Latino patients had significantly higher subscale satisfaction scores for interpersonal manner (P<.0001) and time spent with doctor (P<.005). Variability in patient satisfaction based on primary language spoken and ethnicity has been described in other health care settings. Differences in satisfaction with care, understanding of potential side effects of a medication, compliance, and perceived rapport with physicians have been described.7-9
In addition to validating quality of care through patient satisfaction surveys, providers will be challenged to increase access to dermatologic services. Health systems that accept predominately Medicaid insurance, such as academic medical centers and safety-net hospitals, will be responsible for caring for millions of newly insured Medicaid patients. However, our high and variable nonattendance rates lead to inefficient use of our resources, often reducing the number of patients that are seen.
Canizares and Penneys10 studied an urban dermatology clinic over a 6-month period (N=508) and found that 17% of patients failed to keep their appointments; the subgroup of individuals with state-assisted insurance plans had the highest nonattendance rate (26%).10 In contrast, a group from Canada (N=5300) found that the nonattendance rate in a private dermatology practice was less than 8%.11 Our average nonattendance rate of 30% is within the range for urban clinics10,12; however, our SD of 7% leads to a high variability in patient volume each clinic day. As a result, on many days a reduced number of patients are seen resulting in a higher per-patient cost of delivering care.
Limitations
A potential bias is that the surveys were completed in the clinic and patients may have been concerned about possible repercussions for negative evaluations, which may have skewed results to be more positive than they otherwise would have been. We attempted to minimize this potential bias by having medical students who were not involved in the patients’ care administer the surveys. We also advised patients that their individual surveys would not be given to their providers and that any identifying information would be removed during data analysis. Our inferences could be affected by use of the terms satisfied and very satisfied in our patient satisfaction survey. Although we may interpret the results as patients reporting their degree of satisfaction, the patient may mean that there is room for improvement.13 Therefore, a survey that allows for more varied responses could potentially lead to different results.