M. Barry Sterman, PhD Professor Emeritus, Departments of Neurobiology and Biobehavioral Psychiatry, Geffen School of Medicine, University of California, Los Angeles, CA
Correspondence: M.B. Sterman, PhD, 9773 Blantyre Drive, Beverly Hills, CA 90210; msterman@ucla.edu
Dr. Sterman reported that he has intellectual property rights and ownership in Sterman-Kaiser Imaging Laboratory, for which he also is a member of the board of directors.
ABSTRACT
This review traces the application of electroencephalographic (EEG) operant conditioning, or biofeedback, from animal research to its emergence as an alternative treatment for the major types of seizure disorder. Initial animal studies focusing on brain mechanisms that mediate learned behavioral inhibition revealed a uniquely correlated 12- to 15-Hz EEG rhythm localized to sensorimotor cortex. We labeled this the sensorimotor rhythm, or SMR. The similarity of the SMR to the known EEG spindle pattern during quiet sleep led to the novel idea of attempting to increase the SMR using EEG operant conditioning. The hypothesis was that this might produce a corresponding increase in sleep spindle activity, thus establishing a common EEG marker for the state of motor inhibition. Results supported this hypothesis but led also to the accidental discovery of an anticonvulsant effect on drug-induced seizures in cats and monkeys. Continuing animal studies identified a pattern of neurophysiologic responses correlated with the SMR in primary motor pathways. These and other findings were indicative of reduced motor excitability. Simultaneously, we undertook studies in human epileptic subjects that documented a significant reduction in seizure incidence and severity, together with EEG pattern normalization. This work expanded internationally, resulting in numerous well-controlled group and single-case studies summarized in recent meta-analyses. Exciting new findings in functional neuroimaging/EEG correlation studies provide a rational model for the basis of these clinical effects. In recognition of the diversity of clinical applications of EEG biofeedback and the complexity of seizure disorders, this review also details specific methods used in our EEG biofeedback program.
EEG BIOFEEDBACK IN PRACTICE: PROFILE OF THE AUTHOR’S PROGRAM
EEG operant conditioning methods for biofeedback training have diversified as various hardware and software products have emerged and as individuals with differing backgrounds and credentials have entered the field. A lack of methodologic standards and professional regulations has contributed to an undesirable inconsistency in the competence and effectiveness of therapeutic applications. Nevertheless, abundant peer-reviewed research by qualified investigators has proven the worth of this method as a viable alternative treatment for seizure disorders, so I will attempt to provide some idea of a systematic and evidence-guided approach to treatment as used in our program.
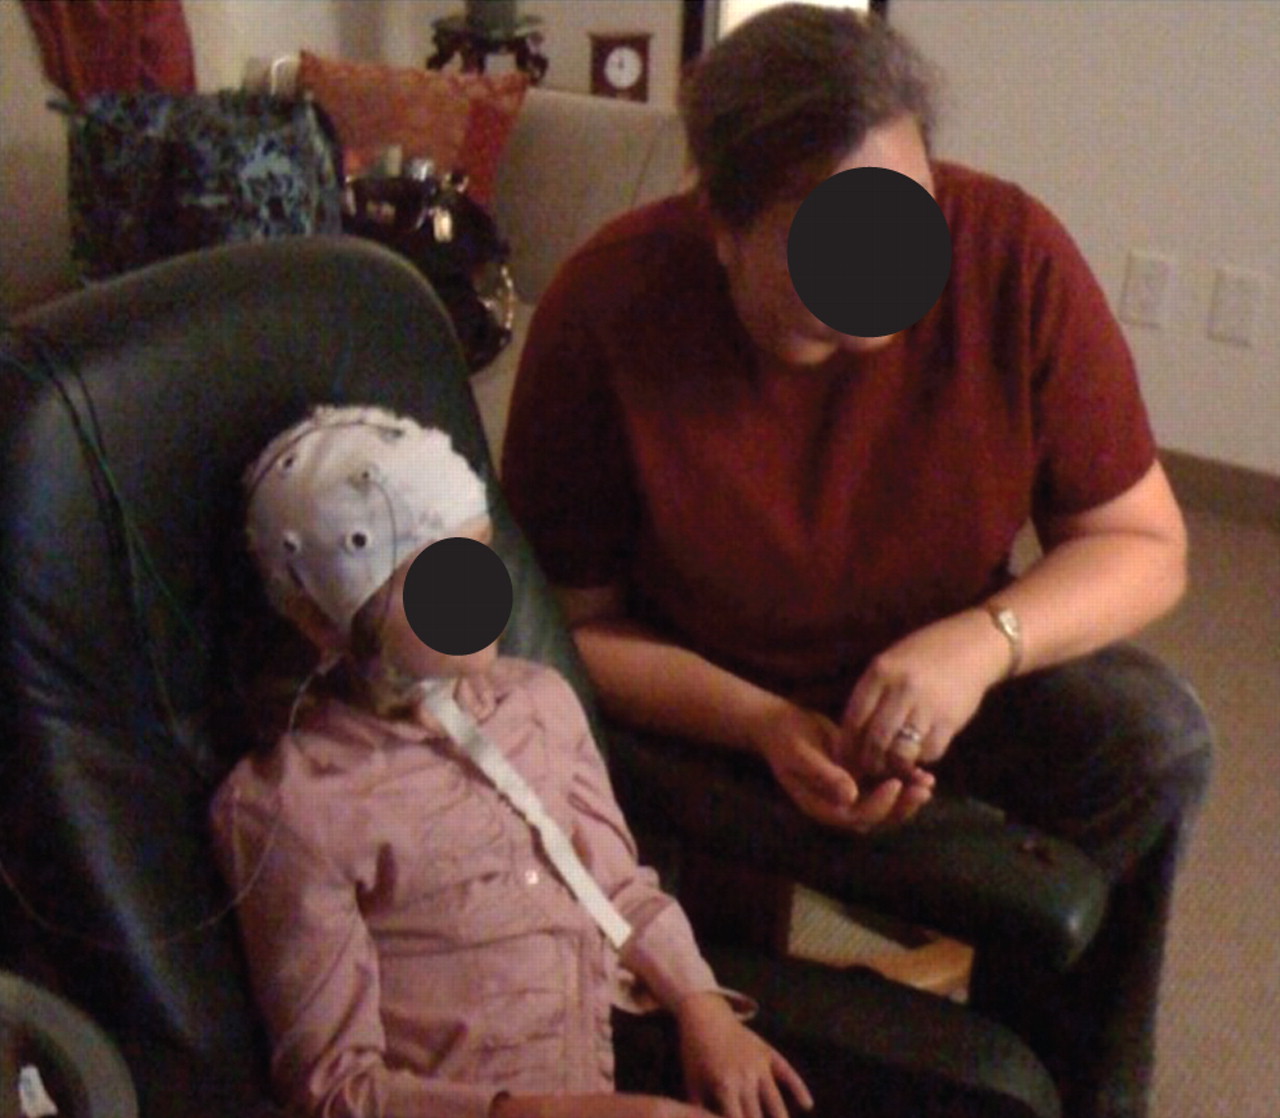
Figure 6. This 12-year-old girl has suffered since early childhood from frequent multiple seizure types and myoclonic jerks that are unresponsive to pharmacologic treatments. She currently functions at about third-grade level but is aware and behaviorally compliant. Here she is responding to visual feedback in the context of sensorimotor rhythm training. Her mother assists by providing raisin and candy rewards when certain response criteria are achieved. Her seizures have declined in frequency and severity.
Patients are subjected to a quantitative multi-channel EEG evaluation (QEEG) using hardware and software complying with both technical and learning-theory principles critical to valid data collection and operant conditioning applications. Data obtained from this study are combined with medical reports from other studies and information gained in a comprehensive intake interview. QEEG and background information guide the design of an empirical protocol, often with several training components, that is used consistently throughout the treatment period, which consists of one or two 60- to 90-minute treatment sessions per week for at least 20 weeks. Subjects are seated in front of a large-monitor screen and instructed on the requirements for reward. Reinforcement consists of visual images and tones, as well as a numeric display of scores achieved and the time remaining in a trial. On rare occasion a committed parent may be seated next to a more challenged patient and provide additional reinforcement in the form of earned treats, such as raisins and pieces of candy (Figure 6).
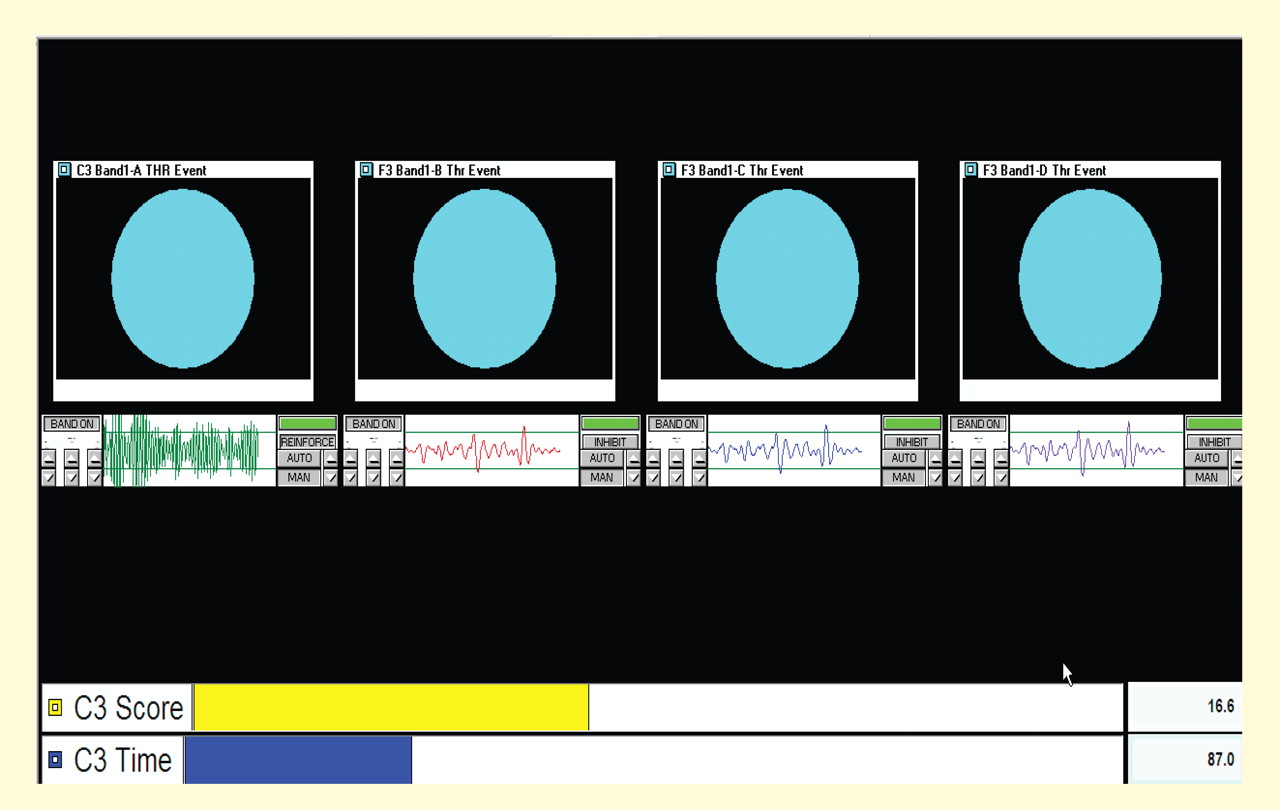
Figure 7. Primary display used in our sensorimotor rhythm biofeedback program. The display conforms strictly to operant conditioning principles while still promoting cognitive engagement in the human subject. Reward here is for two different EEG frequencies at two different cortical sites. The far left “green” site shows reinforced 12- to 15-Hz bandpass activity at the C3 electrode site. Low-frequency suppression of abnormal 3- to 5-Hz slow activity at Fz is addressed here through “successive approximation” and consumes the final three display units from left to right. See text for more details. Display results are for the subject depicted in Figure 6.
The display that subjects see can varies within limits but must always be as simple as possible and must provide information exclusively relevant to achieving the desired EEG changes. One such display is shown in Figure 7. It consists of a series of four rectangular boxes, each with a segment of band-passed EEG data for selected frequency bands and enclosed by reward threshold guidelines. If the objective is to increase the amplitude and/or incidence of a particular frequency band, the band-pass display must exceed the upper threshold guideline. If the objective is to suppress that frequency band, the display must drop below the threshold line. The duration of the required response can be adjusted and is typically 0.25 to 0.5 seconds. When the desired response is achieved a small horizontal bar at the upper right of each band-pass display turns from red to green, and a large blue ball appears above, together with a chime or other tone. The display is frozen for 2 seconds and then becomes active again, thus providing for discrete trials. A yellow score bar at the bottom of the screen advances by one unit. The timing of each performance set (typically 3 minutes) is indicated by a moving blue bar at the bottom of the screen.
With each box monitoring the same electrode site and each frequency tuned to the same band, thresholds can be set to promote facilitation or suppression through “successive approximation,” or sequencing from left to right with sequentially more difficult thresholds. Numerous other configurations are possible. In the case shown in Figure 7, the band-pass at the far left is set at 12 to 15 Hz (SMR) for the C3 electrode site, and the remaining three bands to the right are set to 3 to 5 Hz at the left medial frontal location Fz, with successively lower thresholds to promote suppression of this band at this site.
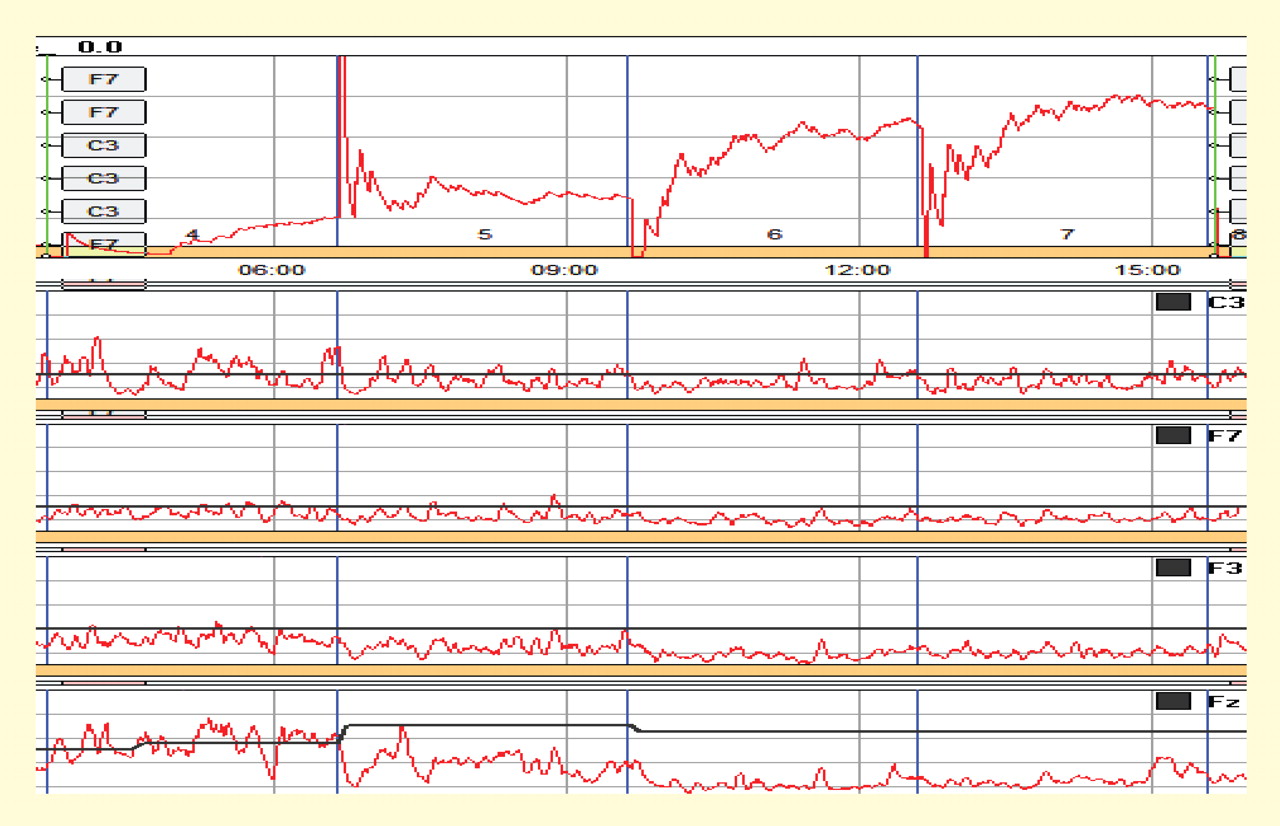
Figure 8. Performance plot from the patient represented in Figures 6 and 7. The plot registers the scoring rate per 3-minute trial at top, along with corresponding smoothed amplitude output in the band-passed frequencies set for each electrode placement. In this case the patient was rewarded for increasing 12- to 15-Hz sensorimotor rhythm (SMR) activity (top EEG trace) and decreasing 3- to 5-Hz slow activity at Fz (bottom EEG trace) The subject showed response acquisition both within and across 3-minute feedback trials, together with a stabilization of the SMR frequency and a reduction in frontal slow activity.
Performance outcome is measured systematically by tracking the scoring rate per trial, together with associated EEG patterns. Data from the 12-year-old female subject described above provide an example. The top of Figure 8 shows a plot of reward rate across four successive 3-minute EEG feedback trials. The patient was rewarded for simultaneously increasing 12- to 15-Hz SMR activity at C3 and reducing 3- to 5-Hz activity at Fz, as described above. Smoothed EEG plots for the targeted frequency bands are shown below these reward curves, starting with the C3 12- to 15-Hz channel. Activity in this band became increasingly stable across trials. Data from three frontal recording sites are also shown, with the targeted Fz 3- to 5-Hz band output at the bottom. Amplitudes decreased progressively at all frontal sites but most markedly at the bottom Fz location. Thus, SMR stabilization and simultaneously suppressed frontal slow activity resulted in a progressive pattern of incremental reward both within trials and across the session. The resulting profiles are indicative of learning.
A RATIONAL MODEL FROM RECENT NEUROIMAGING STUDIES
While it is difficult to evaluate neurophysiologic changes in human subjects to a degree similar to that in animals, certain parallels can be drawn. Further, new imaging methods allow for assessment of localized metabolic changes in the human brain during and after EEG feedback training. Behaviorally, during successful SMR training, human subjects become behaviorally quiet and direct their attention to the task. It is safe to presume that the SMR response develops as a result of reduced motor excitation and resulting intrathalamic ventrobasal oscillations, since this mechanism is well established as a basis for mammalian sensorimotor EEG rhythm generation.12 These changes, as well as others documented in our animal studies, set the stage for the development of SMR activity and are likely collectively initiated by altered input from some other executive system.
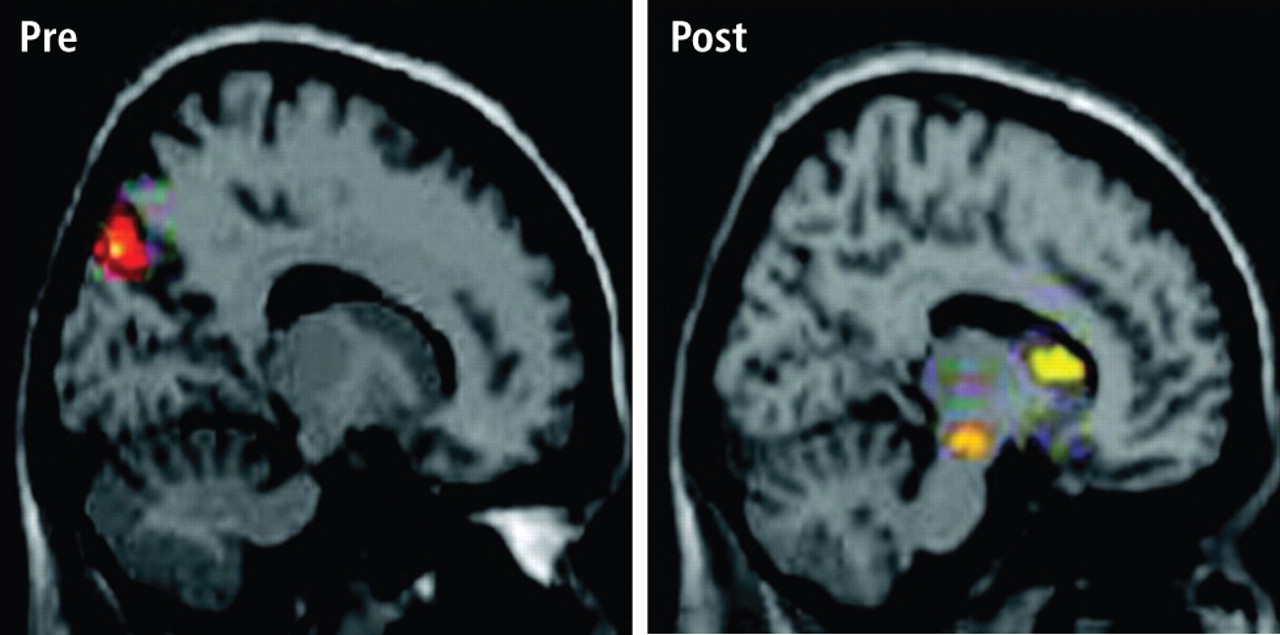
Reprinted from Lévesque J, et al. Effect of neurofeedback training on the neural substrates of selective attention in children with attention-deficit/hyperactivity disorder. Neurosci Lett 2006;394:216-221. Copyright 2006 with permission from Elsevier.
Figure 9. Functional magnetic resonance images before (left) and after (right) sensorimotor rhythm (SMR) feedback training in a study of the effect of SMR training in learning-disabled children.13 The images are sagittal sections for the data averaged across subjects, who either received SMR feedback training (experimental group) or did not (control group). In the pretraining condition, significant loci of activation were noted in the left superior parietal lobe for both groups. In the posttraining condition, activations were again seen in this cortical region for both groups. In addition, the experimental group also showed stronger and statistically significant loci of activation in the left striatum and substantia nigra.
Several recent studies have suggested a specific pattern of motor inhibition output from the striatum of the basal ganglia as the source of these changes. Birbaumer observed increased striatal metabolic activity with functional magnetic resonance imaging (fMRI) analysis in subjects producing SMR activity (personal communication, 2005). Further, Lévesque and colleagues studied pre-/post-fMRI blood oxygenation level–dependent response patterns in learning-disabled children trained to increase SMR activity and found a specific increase in the metabolic activity of the striatum and substantia nigra (Figure 9).13 The SMR-trained subjects showed significant academic improvement as well.13
These facts provide a rational model for a threshold-altering process that could affect seizure discharge propagation to motor networks. Although there are many different neurotransmitters used within the basal ganglia (principally acetylcholine, gamma-aminobutyric acid, and dopamine), the overall effect on thalamus and premotor networks in the mesencephalic tegmentum and superior colliculus is inhibitory.14–16 If activation of these inhibitory basal ganglia networks can become labeled by the SMR through contingent feedback training, and if responsible circuits can be potentiated by this association, motor inhibitory regulation would be generally facilitated.