Comparison of Cardiovascular Outcomes Between Statin Monotherapy and Fish Oil and Statin Combination Therapy in a Veteran Population


Statistics
Demographic and other cohort characterization variables were compared either by a t test, rank sum test, or Fisher exact test given the character of the variable. Kaplan Meier analysis was used to evaluate time to aggregate cardiovascular events and all-cause mortality. VA Informatics and Computing Infrastructure (VINCI) R 3.4.3 was used for data analysis. One of the few combination studies by Macchia and colleagues gave an estimate of unadjusted incident rates for patients treated with statin monotherapy vs fish oil and statin combination therapy in patients having a recent MI.4 Based on this information, a power analysis determined that a 2% difference in incidence rate of adverse cardiovascular events could be detected between the 2 cohorts with 1,000 veterans in the statin cohort, and 500 veterans in the fish oil and statin cohort assuming a time to event interval of about 7.5 years. An α level of 0.05 was set to determine statistical significance.
Results
A total of 3,940 veterans with prescriptions for fish oil or statin therapy were randomly reviewed and sorted based on inclusion and exclusion criteria. This inclusion criteria resulted in 2,575 fish oil and statin combination patients and 1,365 statin monotherapy patients. Exclusion criteria produced a final total of 437 fish oil and statin combination patients and 559 statin monotherapy patients. Patient demographics are presented in Table 3. 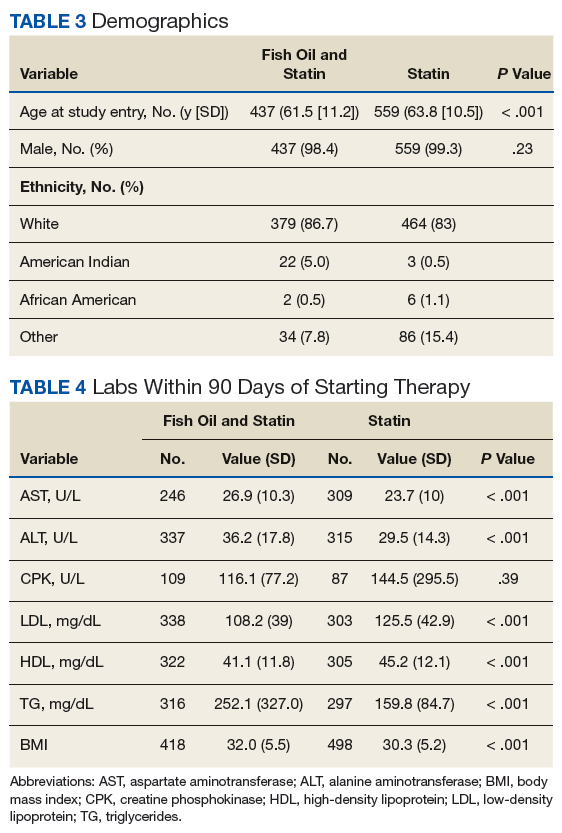
All baseline laboratory data were collected within 90 days of therapy initiation (Table 4). Statin monotherapy patients had lower triglyceride levels compared with those of the fish oil and statin combination patients. However, both high-density lipoprotein (HDL) and low-density lipoprotein (LDL) levels were higher in the statin monotherapy patients. As seen in Table 5, diagnosis of heart failure, hypertension, hypothyroidism, and dyslipidemia were higher in the statin monotherapy cohort, while tobacco use and pancreatitis were more prevalent in the fish oil and statin combination cohort. 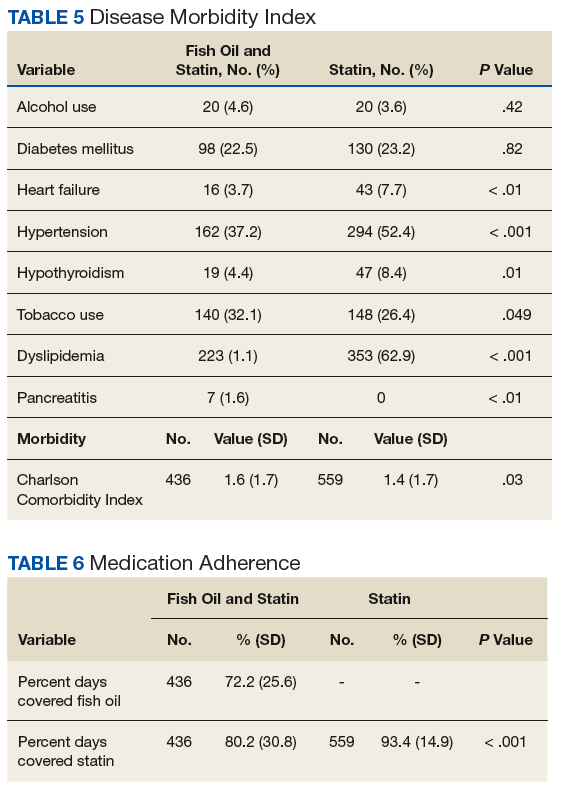
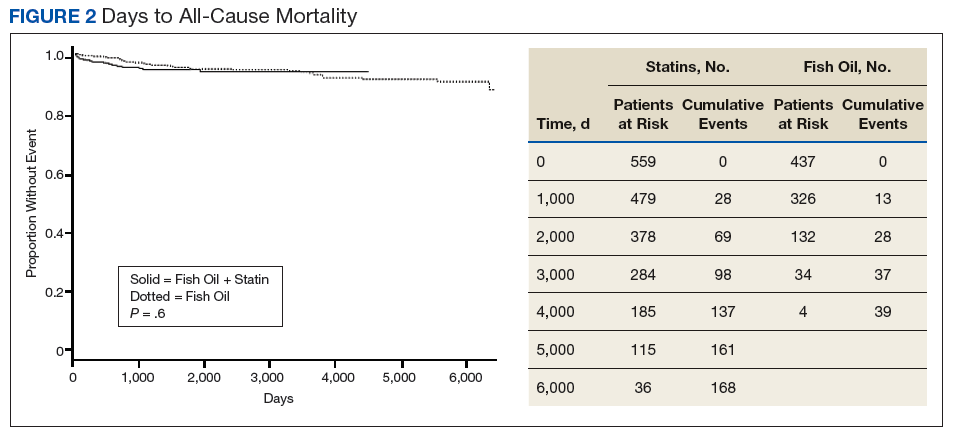
Kaplan Meier curves of the primary outcome, time to aggregate adverse cardiovascular event, and the secondary outcome, time to all-cause mortality are shown in Figure 1 and Figure 2, respectively. This shows adverse cardiovascular events and all-cause mortality for approximately 4,500 days for the fish oil and statin cohort and approximately 6,000 days for the statin monotherapy cohort.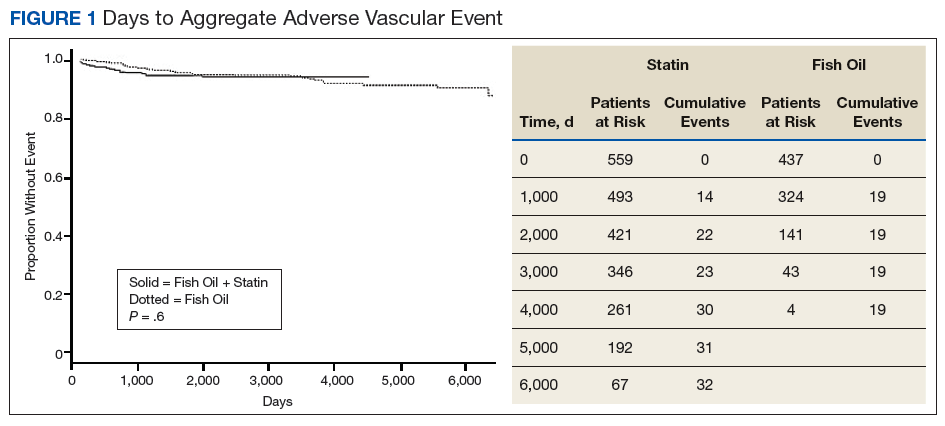
Discussion
Analysis of this study failed to detect a statistically significant difference for time to aggregate adverse cardiovascular events or all-cause mortality. This may be due to fewer adverse cardiovascular events and mortality in the 2 cohorts than was anticipated.