Patient Preferences for Physician Attire: A Multicenter Study in Japan


BACKGROUND: Previous studies have shown that patients have specific expectations regarding physician dress. Japan has a cultural background that is in many ways distinct from western countries. Thus, physician attire may have a different impact in Japan.
METHODS: We conducted a multicenter, cross-sectional study to examine patients’ preferences for and perceptions of physician attire in Japan. The questionnaire was developed using photographs of either a male or female physician dressed in seven different forms of attire, and it was randomly distributed to inpatients and outpatients. Respondents were asked to rate the provider pictured; they were also asked to provide preferences for different forms of attire in varied clinical settings. Preference was evaluated for five domains (knowledgeable, trustworthy, caring, approachable, and comfortable). We also assessed variation in preferences for attire by respondent characteristics.
RESULTS: A total of 1,233 (61%) patients indicated that physician dress was important, and 950 (47%) patients agreed that it influenced their satisfaction with care. Compared with all forms, casual attire with a white coat was the most preferred dress. Older patients more often preferred formal attire with a white coat in primary care and hospital settings. In addition, physician attire had a greater impact on older respondents’ satisfaction and experience.
CONCLUSION: The majority of Japanese patients indicated that physician attire is important and influenced their satisfaction with care. Geography, settings of care, and patient age appear to play a role in patient preferences.
© 2020 Society of Hospital Medicine
Statistical Analyses
Paper-based survey data were entered independently and in duplicate by the study team. Respondents were not required to answer all questions; therefore, the denominator for each question varied. Data were reported as mean and standard deviation (SD) or percentages, where appropriate. Differences in the mean composite rating scores were assessed using one-way ANOVA with the Tukey method for pairwise comparisons. Differences in proportions for categorical data were compared using the Z-test. Chi-squared tests were used for bivariate comparisons between respondent age, gender, and level of education and corresponding respondent preferences. All analyses were performed using Stata 14 MP/SE (Stata Corp., College Station, Texas, USA).
RESULTS
Characteristics of Participants
Between December 1, 2015 and October 30, 2017, a total of 2,020 surveys were completed by patients across four academic hospitals in Japan. Of those, 1,960 patients (97.0%) completed the survey in its entirety. Approximately half of the respondents were 65 years of age or older (49%), of female gender (52%), and reported receiving care in the outpatient setting (53%). Regarding use of healthcare, 91% had seen more than one physician in the year preceding the time of survey completion (Table 1).
Ratings of Physician Attire
Compared with all forms of attire depicted in the survey’s first standalone photograph, respondents rated “casual attire with white coat” the highest (Figure 2). The mean composite score for “casual attire with white coat” was 7.1 (standard deviation [SD] = 1.8), and this attire was set as the referent group. Cronbach’s alpha, for the five items included in the composite score, was 0.95. However, “formal attire with white coat” was rated almost as highly as “casual attire with white coat” with an overall mean composite score of 7.0 (SD = 1.6).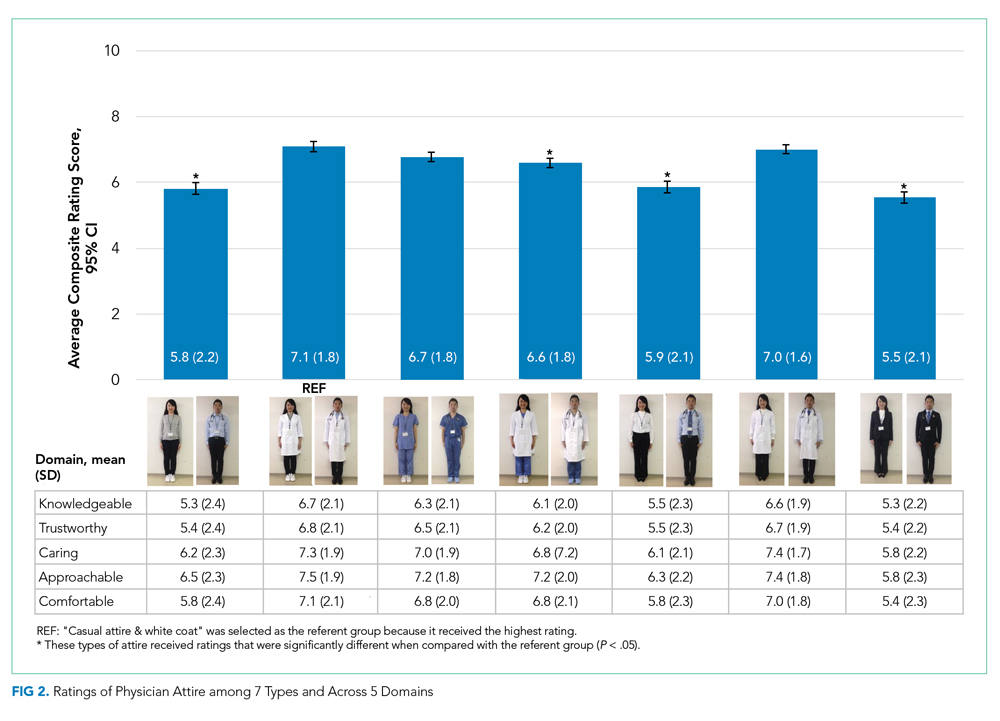
Variation in Preference for Physician Attire by Clinical Setting
Preferences for physician attire varied by clinical care setting. Most respondents preferred “casual attire with white coat” or “formal attire with white coat” in both primary care and hospital settings, with a slight preference for “casual attire with white coat.” In contrast, respondents preferred “scrubs without white coat” in the ED and surgical settings. When asked about their overall preference, respondents reported they felt their physician should wear “formal attire with white coat” (35%) or “casual attire with white coat” (30%; Table 2). When comparing the group of photographs of physicians with white coats to the group without white coats (Figure 1), respondents preferred physicians wearing white coats overall and specifically when providing care in primary care and hospital settings. However, they preferred physicians without white coats when providing care in the ED (P < .001). With respect to surgeons, there was no statistically significant difference between preference for white coats and no white coats. These results were similar for photographs of both male and female physicians.
When asked whether physician dress was important to them and if physician attire influenced their satisfaction with the care received, 61% of participants agreed that physician dress was important, and 47% agreed that physician attire influenced satisfaction (Appendix Table 1). With respect to appropriateness of physicians dressing casually over the weekend in clinical settings, 52% responded that casual wear was inappropriate, while 31% had a neutral opinion.
Participants were asked whether physicians should wear a white coat in different clinical settings. Nearly two-thirds indicated a preference for white coats in the office and hospital (65% and 64%, respectively). Responses regarding whether emergency physicians should wear white coats were nearly equally divided (Agree, 37%; Disagree, 32%; Neither Agree nor Disagree, 31%). However, “scrubs without white coat” was most preferred (56%) when patients were given photographs of various attire and asked, “Which physician would you prefer to see when visiting the ER?” Responses to the question “Physicians should always wear a white coat when seeing patients in any setting” varied equally (Agree, 32%; Disagree, 34%; Neither Agree nor Disagree, 34%).