Impact on Length of Stay of a Hospital Medicine Emergency Department Boarder Service


BACKGROUND: It is not known whether delivering inpatient care earlier to patients boarding in the emergency department (ED) by a hospitalist-led team can decrease length of stay (LOS).
OBJECTIVE: To study the association between care provided by a hospital medicine ED Boarder (EDB) service and LOS.
DESIGN, SETTING, AND PARTICIPANTS: Retrospective cross-sectional study (July 1, 2016 to June 30, 2018) conducted at a single, large, urban academic medical center. Patients admitted to general medicine services from the ED were included. EDB patients were defined as those waiting for more than two hours for an inpatient bed. Patients were categorized as covered EDB, noncovered EDB, or nonboarder.
INTERVENTION: The hospital medicine team provided continuous care to covered EDB patients waiting for an inpatient bed.
PRIMARY OUTCOME AND MEASURES: The primary outcome was median hospital LOS defined as the time period from ED arrival to hospital departure. Secondary outcomes included ED LOS and 30-day ED readmission rate.
RESULTS: There were 8,776 covered EDB, 5,866 noncovered EDB, and 2,026 nonboarder patients. The EDB service covered 59.9% of eligible patients and 62.9% of total boarding hours. Median hospital LOS was 4.76 (interquartile range [IQR] 2.90-7.22) days for nonboarders, 4.92 (IQR 3.00-8.03) days for covered EDB patients, and 5.11 (IQR 3.16-8.34) days for noncovered EDB (P < .001). Median ED LOS for nonboarders was 5.6 (IQR 4.2-7.5) hours, 20.7 (IQR 15.8-24.9) hours for covered EDB, and 10.1 (IQR 7.9-13.8) hours for noncovered EDB (P < .001). There was no difference in 30-day ED readmission rates.
CONCLUSION: Admitted patients who were not boarders had the shortest LOS. Among boarded patients, coverage by a hospital medicine-led EDB service was associated with a reduced hospital LOS.
© 2020 Society of Hospital Medicine
Two hours following a bed request, an ED patient was designated as an eligible EDB patient. Operationally, and for the purposes of this study, patients were separated into three groups: (1) an eligible EDB patient for whom the EDB service assumed care for any portion of their ED stay was considered as a “covered ED boarder,” (2) an eligible EDB patient who did not have any coverage by the EDB service at any point during their ED stay was considered as a “noncovered boarder,” and (3) a patient who received an inpatient bed within two hours of bed request was considered as a “nonboarder”. Patients admitted to a specialty service, intensive care unit, or nonmedical services were not included in any of the abovementioned three groups.
We defined metrics to quantify the extent of EDB team coverage. First, the number of covered EDB patients was divided by all medicine boarders (covered + noncovered) to determine the percentage of medicine EDBs covered. Second, the total patient hours spent under the care of the EDB service was divided by the total boarding hours for all medicine boarders to determine the percentage of boarder hours covered.
Data Sources and Collection
The Electronic Health Record (EHR; Epic Systems Corporation, Verona, Wisconsin) captured whether patients were eligible EDBs. For covered EDB patients, the time when care was assumed by the EDB service was captured electronically. Patient demographics, admitting diagnoses, time stamps throughout the hospitalization, admission volumes, LOS, and discharge disposition were extracted from the EHR.
Primary and Secondary Outcome Measures
The primary outcome of this study was hospital LOS defined as the time from ED arrival to hospital departure (Figure). Secondary outcomes included ED LOS (time from ED arrival to ED departure) and the rate of 30-day ED readmission to the study institution.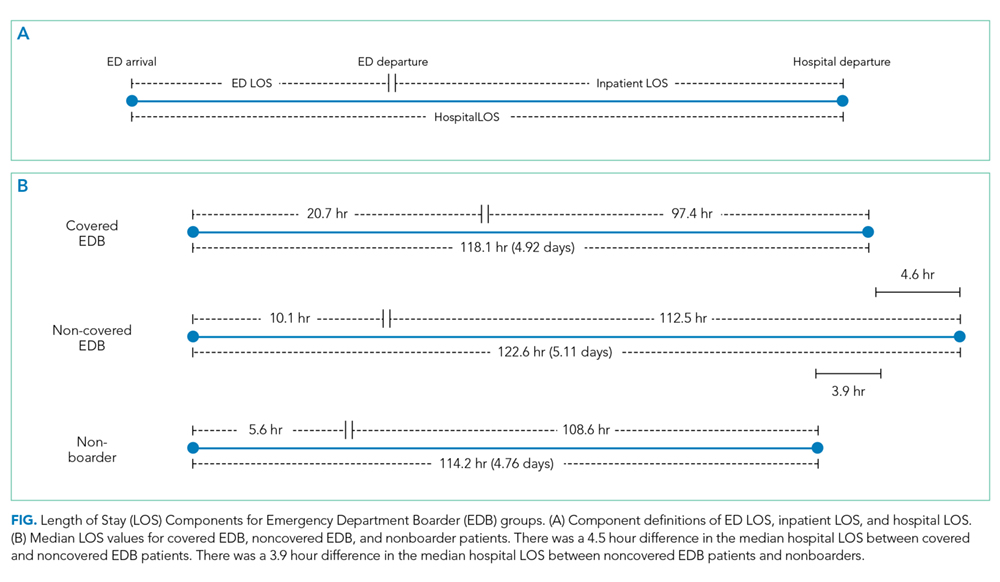
Statistical Analysis
SAS version 9.4 (SAS Institute, Cary, North Carolina) was used for all statistical analyses. Continuous outcomes were compared using the Mann–Whitney test and dichotomized outcomes were compared using chi-square tests. We further analyzed the differences in the primary and secondary outcomes between covered and noncovered EDB groups using a multivariable regression analysis adjusting for age, gender, race, academic year, hour of the day, and day of the week at the time of becoming an EDB. We used quantile regression and linear regression with log-transformed continuous outcomes and logistic regression for the dichotomized outcome. A P value of .05 was used as a threshold for statistical significance.
RESULTS
Study Population and Demographics
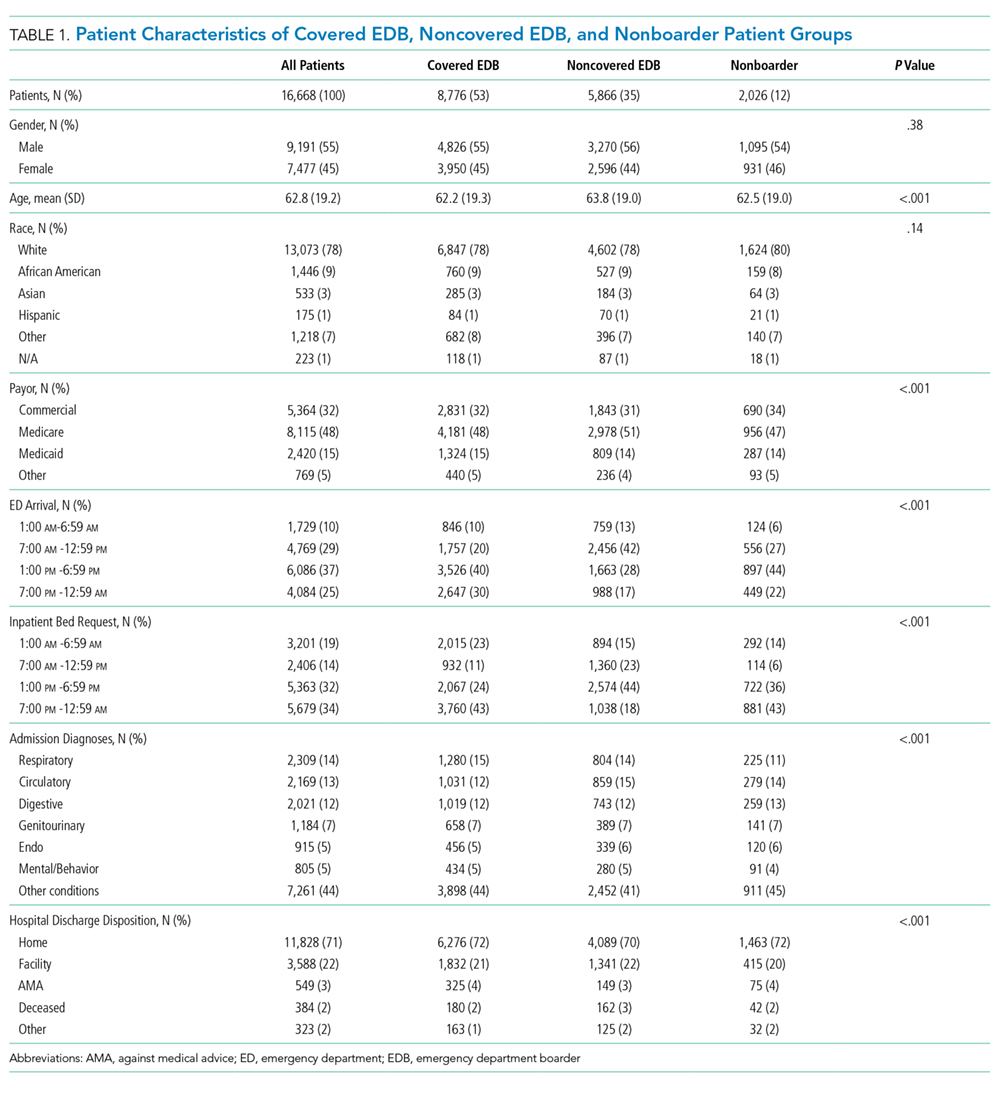
There were a total of 16,668 patients admitted from the ED to the general medical services during the study period (Table 1). There were 8,776 (53%) patients in the covered EDB group, 5,866 (35%) patients in the noncovered EDB group, and 2,026 (12%) patients in the nonboarder group. There were more patients admitted during AY17 compared with AY16 (8,934 vs 7,734 patients, respectively, Appendix 1). Patient demographics, including age, gender, race, insurance coverage, admitting diagnoses, and discharge disposition, were similar among all three patient groups (Table 1). A majority of patients in the covered EDB and nonboarder groups presented to the ED in the afternoon, whereas noncovered EDB patients presented more in the morning (Table 1). Consistent with this pattern, inpatient bed requests for covered EDB and nonboarder patients were more frequent between 7