Improving Respiratory Rate Accuracy in the Hospital: A Quality Improvement Initiative


Respiratory rate (RR) is a predictor of adverse outcomes. However, RRs are inaccurately measured in the hospital. We conducted a quality improvement (QI) initiative using plan-do-study-act methodology on one inpatient unit of a safety-net hospital to improve RR accuracy. We added time-keeping devices to vital sign carts and retrained patient-care assistants on a newly modified workflow that included concomitant RR measurement during automated blood pressure measurement. The median RR was 18 (interquartile range [IQR] 18-20) preintervention versus 14 (IQR 15-20) postintervention. RR accuracy, defined as ±2 breaths of gold-standard measurements, increased from 36% preintervention to 58% postintervention (P < .01). The median time for vital signs decreased from 2:36 minutes (IQR, 2:04-3:20) to 1:55 minutes (IQR, 1:40-2:22; P < .01). The intervention was associated with a 7.8% reduced incidence of tachypnea-specific systemic inflammatory response syndrome (SIRS = 2 points with RR > 20; 95% CI, –13.5% to –2.2%). Our interdisciplinary, low-cost, low-tech QI initiative improved the accuracy and efficiency of RR measurement.
© 2019 Society of Hospital Medicine
Respiratory Rate Accuracy
PCA-recorded RRs were considered accurate if the RR was within ±2 breaths of a gold-standard RR measurement performed by a trained study member (NK or KB). We conducted gold-standard RR measurements for 100 observations pre- and postintervention within 30 minutes of PCA measurement to avoid Hawthorne bias.
We assessed the variability of recorded RRs in the EHR for all patients in the intervention unit as a proxy for accuracy. We hypothesized on the basis of prior research that improving the accuracy of RR measurement would increase the variability and normality of distribution in RRs.13 This is an approach that we have employed previously.7 The EHR cohort included consecutive hospitalizations by patients who were admitted to either the intervention unit or to one of two nonintervention general medicine inpatient units that served as concurrent controls. We grouped hospitalizations into a preintervention phase from March 1, 2017-July 22, 2017, a planning phase from July 23, 2017-December 3, 2017, and a postintervention phase from December 21, 2017-February 28, 2018. Hospitalizations during the two-week teaching phase from December 3, 2017-December 21, 2017 were excluded. We excluded vital signs obtained in the emergency department or in a location different from the patient’s admission unit. We qualitatively assessed RR distribution using histograms as we have done previously.7
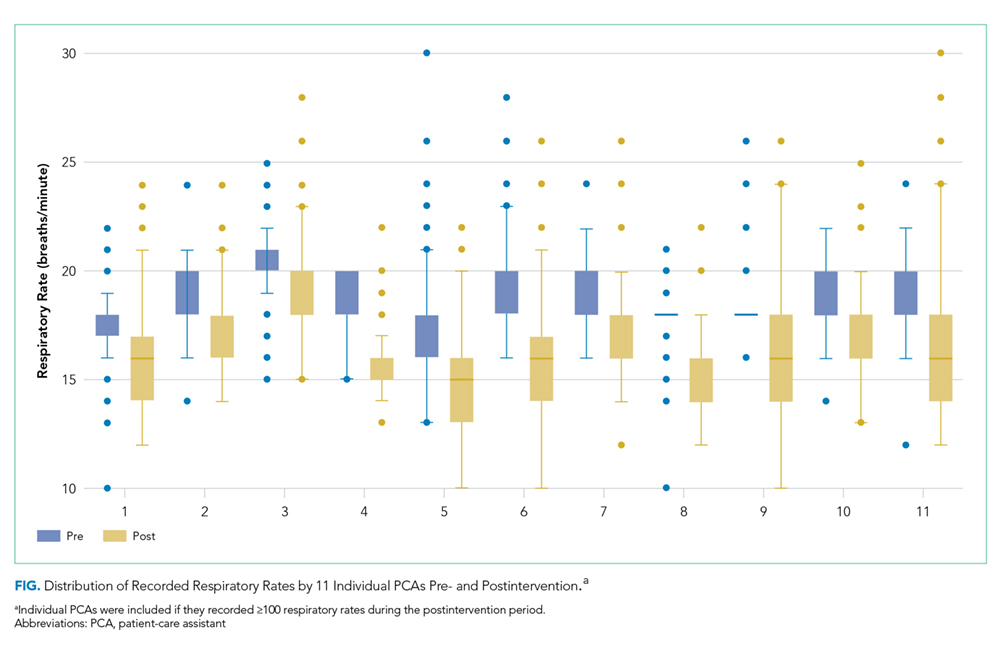
We examined the distributions of RRs recorded in the EHR before and after intervention by individual PCAs on the intervention floor to assess for fidelity and adherence in the PCA uptake of the intervention.
Time
We compared the time to complete vital sign measurement among convenience samples of 50 unique observations pre- and postintervention using the Wilcoxon rank sum test.
SIRS Incidence
Since we hypothesized that improved RR accuracy would reduce falsely elevated RRs but have no impact on the other three SIRS criteria, we assessed changes in tachypnea-specific SIRS incidence, which was defined a priori as the presence of exactly two concurrent SIRS criteria, one of which was an elevated RR.3 We examined changes using a difference-in-differences approach with three different units of analysis (per vital sign measurement, hospital-day, and hospitalization; see footnote for Appendix Table 1 for methodological details. All analyses were conducted using STATA 12.0 (StataCorp, College Station, Texas).
RESULTS
Respiratory Rate Accuracy
Prior to the intervention, the median PCA RR was 18 (IQR 18-20) versus 12 (IQR 12-18) for the gold-standard RR (Appendix Figure 1), with only 36% of PCA measurements considered accurate. After the intervention, the median PCA-recorded RR was 14 (IQR 15-20) versus 14 (IQR 14-20) for the gold-standard RR and a RR accuracy of 58% (P < .001).
For our analyses on RR distribution using EHR data, we included 143,447 unique RRs (Appendix Table 2). After the intervention, the normality of the distribution of RRs on the intervention unit had increased, whereas those of RRs on the control units remained qualitatively similar pre- and postintervention (Appendix Figure 2).
Notable differences existed among the 11 individual PCAs (Figure) despite observing increased variability in PCA-recorded RRs postintervention. Some PCAs (numbers 2, 7, and 10) shifted their narrow RR interquartile range lower by several breaths/minute, whereas most other PCAs had a reduced median RR and widened interquartile range.