An Acute Care for Elders Quality Improvement Program for Complex, High-Cost Patients Yields Savings for the System


BACKGROUND: Acute Care for Elders (ACE) programs improve outcomes for older adults; however, little is known about whether impact varies with comorbidity severity.
OBJECTIVE: To describe differences in hospital-level outcomes between ACE and routine care across various levels of comorbidity burden.
DESIGN: Cross-sectional quality improvement study.
SETTING: A 716-bed teaching hospital.
PARTICIPANTS: Medical inpatients aged ≥70 years hospitalized between September 2014 and August 2017.
INTERVENTION: ACE care, including interprofessional rounds, geriatric syndromes screening, and care protocols, in an environment prepared for elders
MEASUREMENTS: Total cost, length of stay (LOS), and 30-day readmissions. We calculated median differences for cost and LOS between ACE and usual care and explored variations across the distribution of outcomes at the 25th, 50th, 75th and 90th percentiles. Results were also stratified across quartiles of the combined comorbidity score.
RESULTS: A total of 1,429 ACE and 10,159 non-ACE patients were included in this study. The mean age was 81 years, 57% were female, and 81% were white. ACE patients had lower costs associated with care ranging from $171 at the 25th percentile to $3,687 at the 90th percentile, as well as lower LOS ranging from 0 days at the 25th percentile to 1.9 days at the 90th percentile. After stratifying by comorbidity score, the greatest differences in outcomes were among those with higher scores. There was no difference in 30-day readmission between the groups.
CONCLUSION: The greatest reductions in cost and LOS were in patients with greater comorbidity scores. Risk stratification may help hospitals prioritize admissions to ACE units to maximize the impact of the more intensive intervention.
© 2019 Society of Hospital Medicine
The median cost per ACE patient was slightly lower at $6,258 (interquartile range [IQR] = $4,683-$8,547) versus $6,858 (IQR = $4,855-$10,478) in usual care. Across the cost distribution, the ACE program had lower costs than usual care; however, these differences became more pronounced at the higher end of the distribution. For example, compared with the ACE group, the usual-care group’s unadjusted cost difference was $171 higher at the 25th percentile, $600 higher at the median, $1,932 higher at the 75th percentile, and $3,687 higher at the 90th percentile. The ACE median LOS was 3.7 days (IQR = 2.7-5.0) compared with 3.8 days (IQR = 2.7-6.0) for non-ACE patients. Similar to cost, LOS differences rose at higher percentiles of the distribution, with shorter stays for the ACE patients within each grouping. Compared with the ACE group, the unadjusted LOS difference for usual-care patients ranged from 0 days at the 25th percentile to 0.2 day longer at the median, 1.0 day longer at the 75th percentile, and 1.9 days longer at the 90th percentile. For both cost and LOS models, estimates remained stable after adjusting for age and combined comorbidity score (Table 2).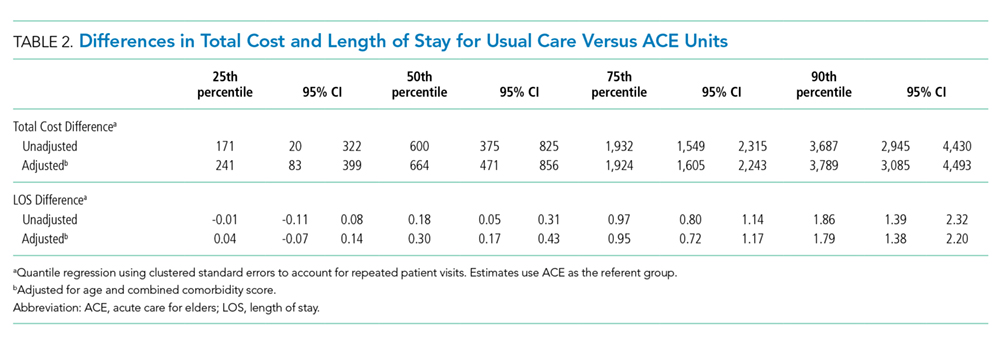
We explored the impact of increasing comorbidity burden on these outcomes using the following quartiles of the combined comorbidity score: −2 to 0 (387 ACE vs 3,322 usual-care patients), 1 to 2 (264 ACE vs 1,856 usual-care patients), 3 to 5 (476 ACE vs 2,859 usual-care patients), and 6 to 15 (301 ACE vs 2,122 usual-care patients). It was not surprising that cost and LOS paralleled each other, with the greatest cost and LOS benefits in the highest quartile of the combined comorbidity score (Figure 1). For example, at the 90th percentile, the cost difference approached $6,000 higher for the usual-care group in the top quartile of combined comorbidity score compared with nearly $3,000 higher for the lowest quartile. Similarly, at the 90th percentile, LOS for usual-care patients was 2.9 days longer at the top quartile compared with 1.7 days longer at the lowest quartile.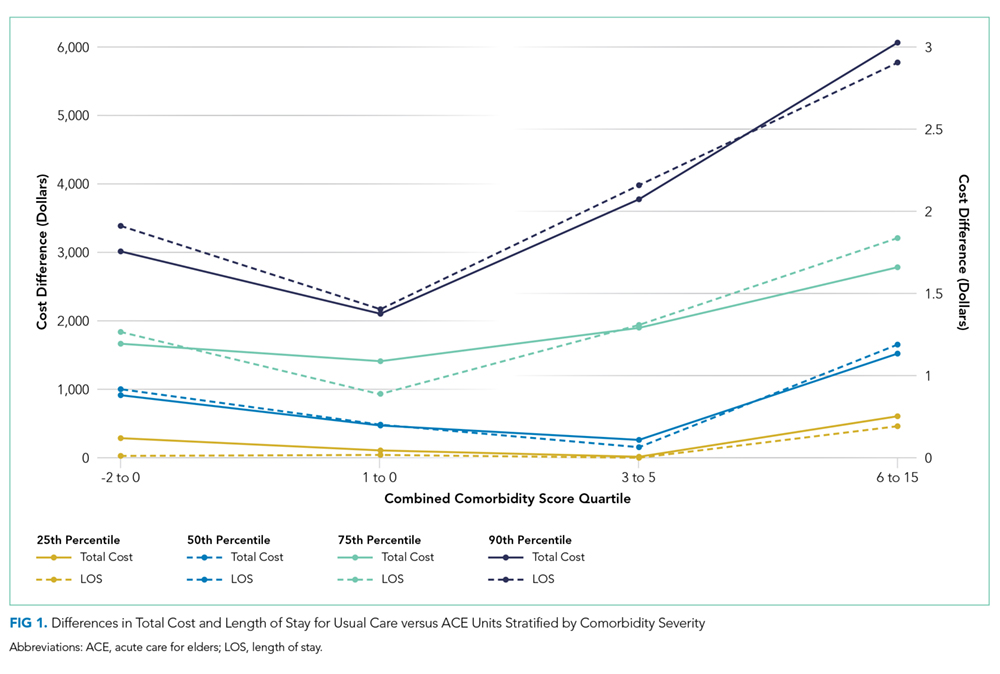
The all-cause 30-day readmission risk was similar for both groups, with an absolute risk difference of −0.7% (95% CI = −2.6% to 1.3%). Adjustment for age and comorbidity score did not substantially change this result. Following stratification by quartile of combined comorbidity scores, we observed similar readmission risks at each quartile (Figure 2).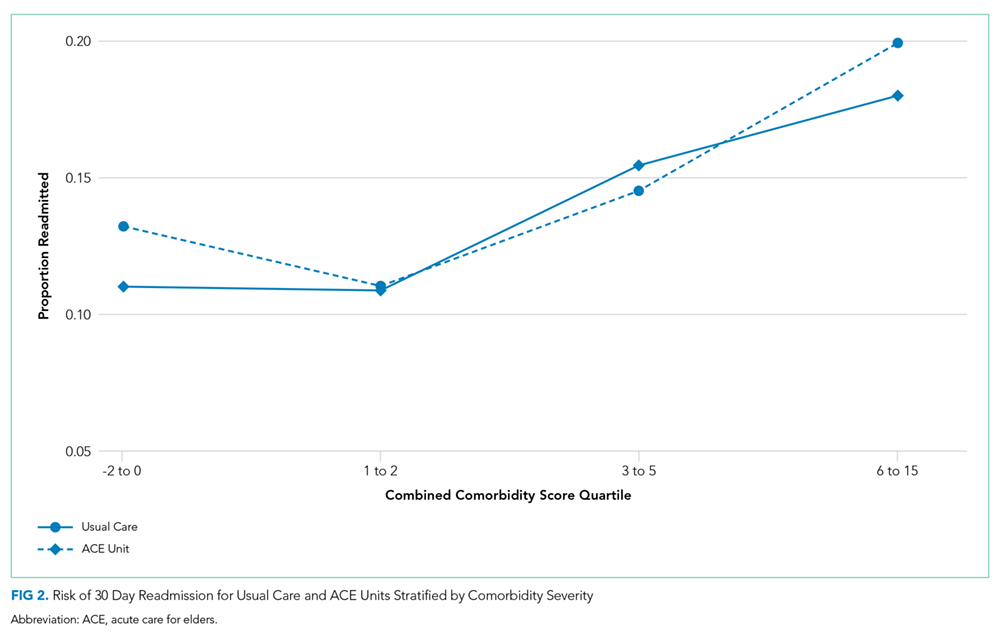
DISCUSSION
This quality improvement initiative evaluated which ACE admissions yielded the greatest value and found the largest reductions in LOS and cost in patients with the greatest comorbidity scores (frequently referred to as “high need, high cost”).23,24 Based on prior literature, we had anticipated that moderate risk patients would show the maximum benefit.15,25 In contrast to our findings, a University of Alabama (UAB) ACE program subgroup analysis using the CMS Case Mix Index (CMI) found a cost reduction for patients with low or intermediate CMI scores but not for those with high scores.15 The Hospital Elder Life Program (HELP) has yielded maximal impact for patients at moderate risk for delirium.26 Our results are supported by a University of Texas, Houston, study revealing lower LOS and cost for ACE patients, despite high CMI scores and endemic frailty, although it did not report outcomes across a range of comorbidities or costs.27 Our results may be determined by the specific characteristics of the Baystate ACE initiative. Our emphasis on considering prognosis and encouraging advance care planning could have contributed to the improved metrics for more complicated patients. It is possible that patients with high comorbidity burden were more likely to screen in with the surprise question, leading to more frequent goals of care discussions by the hospitalists or geriatrics team, which, in turn, may have resulted in less aggressive care and consequently lower costs. The emphasis on prognosis and palliative care was not a feature of the UAB or Texas studies. Additional components, such as the delirium screening and the presence of volunteer advocates, could also have impacted the results. Our tiered approach during rounds with rapid reviews for most patients and longer discussions for those at highest risk may have further contributed to the findings. Finally, although we did not track the recommendation acceptance rate for the entire study period, in the first 9 months of the project, 9,325 recommendations were made with an acceptance rate of >85%. We previously reported a similar acceptance rate for medication recommendations.28 Another factor contributing to our results may be the ways in which we categorized patients and calculated costs. We used the Gagne combined comorbidity score, which includes only prior conditions;21 the UAB study used CMI, which includes severity of presenting illness and complications, as well as baseline comorbidities. We also compared total cost, while UAB reported variable direct cost.
