Sepsis Presenting in Hospitals versus Emergency Departments: Demographic, Resuscitation, and Outcome Patterns in a Multicenter Retrospective Cohort


BACKGROUND: Differences between hospital-presenting sepsis (HPS) and emergency department-presenting sepsis (EDPS) are not well described.
OBJECTIVES: We aimed to (1) quantify the prevalence of HPS versus EDPS cases and outcomes; (2) compare HPS versus EDPS characteristics at presentation; (3) compare HPS versus EDPS in process and patient outcomes; and (4) estimate risk differences in patient outcomes attributable to initial resuscitation disparities.
DESIGN: Retrospective consecutive-sample cohort.
SETTING: Nine hospitals from October 1, 2014, to March 31, 2016.
PATIENTS: All hospitalized patients with sepsis or septic shock, as defined by simultaneous (1) infection, (2) ≥2 Systemic Inflammatory Response Syndrome (SIRS) criteria, and (3) ≥1 acute organ dysfunction criterion. EDPS met inclusion criteria while physically in the emergency department (ED). HPS met the criteria after leaving the ED.
MEASUREMENTS: We assessed overall HPS versus EDPS contributions to case prevalence and outcomes, and then compared group differences. Process outcomes included 3-hour bundle compliance and discrete bundle elements (eg, time to antibiotics). The primary patient outcome was hospital mortality.
RESULTS: Of 11,182 sepsis hospitalizations, 2,509 (22.4%) were hospital-presenting. HPS contributed 785 (35%) sepsis mortalities. HPS had more frequent heart failure (OR: 1.31, CI: 1.18-1.47), renal failure (OR: 1.62, CI: 1.38-1.91), gastrointestinal source of infection (OR: 1.84, CI: 1.48-2.29), euthermia (OR: 1.45, CI: 1.10-1.92), hypotension (OR: 1.85, CI: 1.65-2.08), or impaired gas exchange (OR: 2.46, CI: 1.43-4.24). HPS were admitted less often from skilled nursing facilities (OR: 0.44, CI: 0.32-0.60), had chronic obstructive pulmonary disease (OR: 0.53, CI: 0.36-0.78), tachypnea (OR: 0.76, CI: 0.58-0.98), or acute kidney injury (OR: 0.82, CI: 0.68-0.97). In a propensity-matched cohort (n = 3,844), HPS patients had less than half the odds of 3-hour bundle compliant care (17.0% vs 30.3%, OR: 0.47, CI: 0.40-0.57) or antibiotics within three hours (66.2% vs 83.8%, OR: 0.38, CI: 0.32-0.44) vs EDPS. HPS was associated with higher mortality (31.2% vs 19.3%, OR: 1.90, CI: 1.64-2.20); 23.3% of this association was attributable to differences in initial resuscitation (resuscitation-adjusted OR: 1.69, CI: 1.43-2.00).
CONCLUSIONS: HPS differed from EDPS by admission source, comorbidities, and clinical presentation. These patients received markedly less timely initial resuscitation; this disparity explained a moderate proportion of mortality differences.
© 2019 Society of Hospital Medicine
RESULTS
Prevalence and Outcome Contributions
Of the 11,182 sepsis patients in the database, we classified 2,509 (22%) as HPS (Figure 1). HPS contributed 785 (35%) of 2,241 sepsis-related mortalities, 1,241 (38%) mechanical ventilations, and 1,762 (34%) ICU admissions. Of 39,263 total ICU days and 127,178 hospital days, HPS contributed 18,104 (46.1%) and 44,412 (34.9%) days, respectively.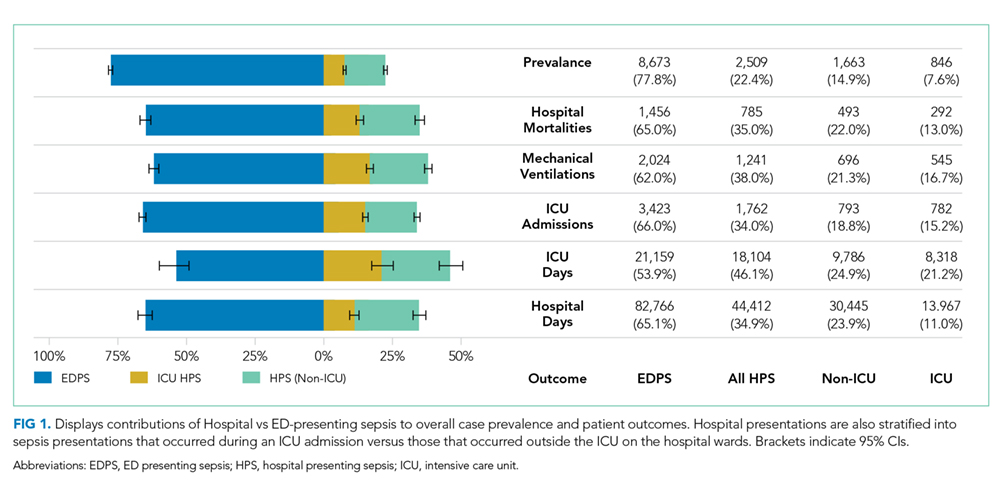
Patient Characteristics
Most HPS presented early in the hospital course, with 1,352 (53.9%) cases meeting study criteria within three days of admission. Median time from admission to meeting study criteria for HPS was two days (interquartile range: one to seven days). We report selected baseline patient characteristics in Table 1 and adjusted associations of baseline variables with HPS versus EDPS in Table 2. The full cohort characterization is available in Supplemental Table 3. Notably, HPS patients more often had CHF (aOR [adjusted odds ratio}: 1.31, CI: 1.18-1.47) or renal failure (aOR: 1.62, CI: 1.38-1.91), gastrointestinal source of infection (aOR: 1.84, CI: 1.48-2.29), hypothermia (aOR: 1.56, CI: 1.28-1.90) hypotension (aOR: 1.85, CI: 1.65-2.08), or altered gas exchange (aOR: 2.46, CI: 1.43-4.24). In contrast, HPS patients less frequently were admitted from skilled nursing facilities (aOR: 0.44, CI: 0.32-0.60), or had COPD (aOR: 0.53, CI: 0.36-0.76), fever (aOR: 0.70, CI: 0.52-0.91), tachypnea (aOR: 0.76, CI: 0.58-0.98), or AKI (aOR: 082, CI: 0.68-0.97). Other baseline variables were similar, including respiratory source, tachycardia, white cell abnormalities, AMS, and coagulopathies. These associations were preserved in the sensitivity analysis excluding ICU-presenting sepsis.
Propensity Matching
Propensity score matching yielded 1,942 matched pairs (n = 3,884, 77% of HPS patients, 22% of EDPS patients). Table 1 and Supplemental Table 3 show patient characteristics after propensity matching. Supplemental Table 4 shows the propensity model. The frequency densities are shown for the cohort as a function of propensity score in Supplemental Figure 1. After matching, frequencies between groups differed by <5% for all categorical variables assessed. In the sensitivity analysis, propensity matching (model in Supplemental Table 5) resulted in 1,233 matched pairs (n = 2,466, 49% of HPS patients, 14% of EDPS patients), with group differences comparable to the primary analysis.
Process Outcomes
We present propensity-matched differences in initial resuscitation in Figure 2A for all HPS patients, as well as non-ICU-presenting HPS, versus EDPS. HPS patients were roughly half as likely to receive fully 3-hour bundle compliant care (17.0% vs 30.3%, aOR: 0.47, CI: 0.40-0.57), to have blood cultures drawn within three hours prior to antibiotics (44.9% vs 67.2%, aOR: 0.40, CI: 0.35-0.46), or to receive fluid resuscitation initiated within two hours (11.1% vs 26.1%, aOR: 0.35, CI: 0.29-0.42). Antibiotic receipt within one hour was comparable (45.3% vs 48.1%, aOR: 0.89, CI: 0.79-1.01). However, differences emerged for antibiotics within three hours (66.2% vs 83.8%, aOR: 0.38, CI: 0.32-0.44) and persisted at six hours (77.0% vs 92.5%, aOR: 0.27, CI: 0.22-33). Excluding ICU-presenting sepsis from propensity matching exaggerated disparities in antibiotic receipt at one hour (43.4% vs 49.1%, aOR: 0.80, CI: 0.68-0.93), three hours (64.2% vs 86.1%, aOR: 0.29, CI: 0.24-0.35), and six hours (75.7% vs 93.0%, aOR: 0.23, CI: 0.18-0.30). HPS patients more frequently had repeat lactate obtained within 24 hours (62.4% vs 54.3%, aOR: 1.40, CI: 1.23-1.59).
