Statistical Modeling and Aggregate-Weighted Scoring Systems in Prediction of Mortality and ICU Transfer: A Systematic Review


BACKGROUND: The clinical deterioration of patients in general hospital wards is an important safety issue. Aggregate-weighted early warning systems (EWSs) may not detect risk until patients present with acute decline.
PURPOSE: We aimed to compare the prognostic test accuracy and clinical workloads generated by EWSs using statistical modeling (multivariable regression or machine learning) versus aggregate-weighted tools.
DATA SOURCES: We searched PubMed and CINAHL using terms that described clinical deterioration and use of an advanced EWS.
STUDY SELECTION: The outcome was clinical deterioration (intensive care unit transfer or death) of adult patients on general hospital wards. We included studies published from January 1, 2012 to September 15, 2018.
DATA EXTRACTION: Following 2015 PRIMSA systematic review protocol guidelines; 2015 TRIPOD criteria for predictive model evaluation; and the Cochrane Collaboration guidelines, we reported model performance, adjusted positive predictive value (PPV), and conducted simulations of workup-to-detection ratios.
DATA SYNTHESIS: Of 285 articles, six studies reported the model performance of advanced EWSs, and five were of high quality. All EWSs using statistical modeling identified at-risk patients with greater precision than aggregate-weighted EWSs (mean AUC 0.80 vs 0.73). EWSs using statistical modeling generated 4.9 alerts to find one true positive case versus 7.1 alerts in aggregate-weighted EWSs; a nearly 50% relative workload increase for aggregate-weighted EWSs.
CONCLUSIONS: Compared with aggregate-weighted tools, EWSs using statistical modeling consistently demonstrated superior prognostic performance and generated less workload to identify and treat one true positive case. A standardized approach to reporting EWS model performance is needed, including outcome definitions, pretest probability, observed and adjusted PPV, and workup-to-detection ratio.
© 2019 Society of Hospital Medicine
RESULTS
Search Results
The PubMed search for “early warning score OR early warning system AND deterioration OR predict transfer ICU” returned 285 peer-reviewed articles. A search on CINAHL Plus using the same filters and query terms returned 219 articles with no additional matches (Figure 1). Of the 285 articles, we excluded 269 during the abstract screen and 10 additional articles during full-text review (Figure 1). A final review of the reference lists of the six selected studies did not yield additional articles.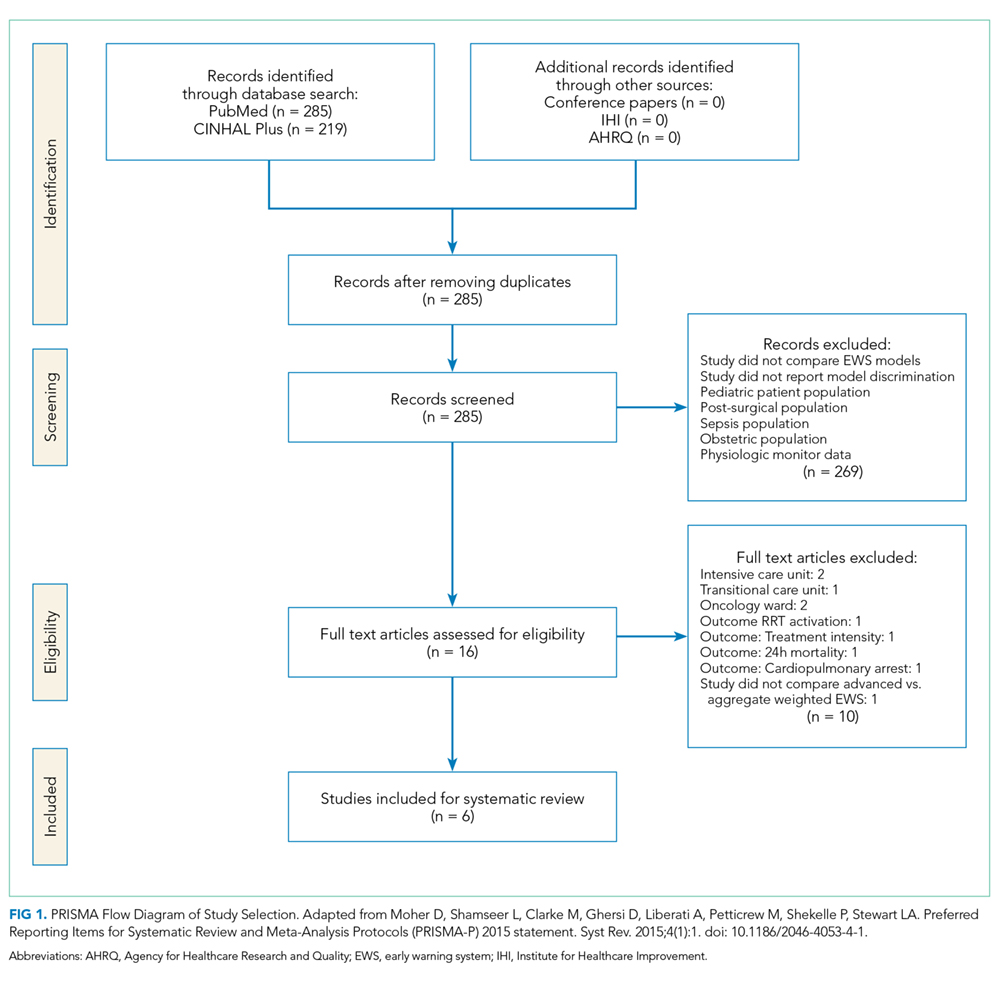
Study Characteristics
There were several similarities across the selected studies (Table 1). All occurred in the United States; all compared their model’s performance against at least one aggregate-weighted EWS model;14,17-19,29 and all used retrospective cohort designs. Of the six studies, one took place in a single hospital;29 three pooled data from five hospitals;17,18,30 and two occurred in a large integrated healthcare delivery system using data from 14 and, subsequently, 21 hospitals.14,19 The largest study14 included nearly 650,000 admissions, while the smallest study29 reported slightly less than 7,500 admissions. Of the six studies, four used multivariable regression,14,17,19,29 and two used machine learning techniques for outcome prediction.18,30
Outcome Variables
The primary outcome for inclusion in this review was clinical deterioration measured by the composite of transfer to ICU and some measure of mortality. Churpek et al.10,11 and Green et al.30 also included cardiac arrest, and Alvarez et al.22 included respiratory compromise in their outcome composite.
Researchers used varying definitions of mortality, including “death outside the ICU in a patient whose care directive was full code;”14,19 “death on the wards without attempted resuscitation;”17,18 “an in-hospital death in patients without a DNR order at admission that occurred on the medical ward or in ICU within 24 hours after transfer;”29 or “death within 24 hours.”30
Predictor Variables
We observed a broad assortment of predictor variables. All models included vital signs (heart rate, respiratory rate, blood pressure, and venous oxygen saturation); mental state; laboratory data; age; and sex. Additional variables included comorbidity, shock index,31 severity of illness score, length of stay, event time of day, season, admission category, and length of stay,14,19 among others.
Model Performance
Reported PPV ranged from 0.16 to 0.42 (mean = 0.27) in EWSs using statistical modeling and 0.15 to 0.28 (mean = 0.19) in aggregate-weighted EWS models. The weighted mean standardized PPV, adjusted for an event rate of 4% across studies (Table 2), was 0.21 in EWSs using statistical modeling versus 0.14 in aggregate-weighted EWS models (simulated at 0.51 sensitivity and 0.87 specificity).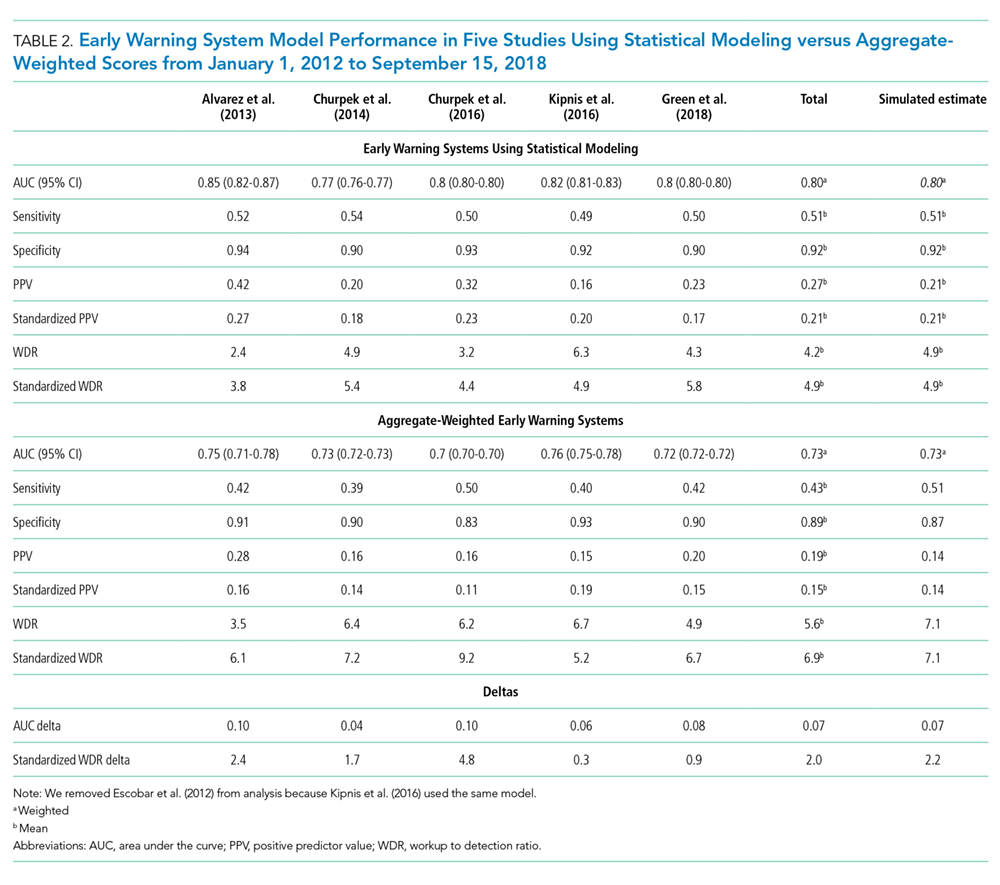
Only two studies14,19 reported the WDR metric (alerts generated to identify one true positive case) explicitly. Based on the above PPV results, EWSs using statistical modeling generated a standardized WDR of 4.9 in models using statistical modeling versus 7.1 in aggregate-weighted models (Figure 2). The delta of 2.2 evaluations to find and treat one true positive case equals a 45% relative increase in RRT evaluation workloads using aggregate-weighted EWSs.
AUC values ranged from 0.77 to 0.85 (weighted mean = 0.80) in EWSs using statistical modeling, indicating good model discrimination. AUCs of aggregate-weighted EWSs ranged from 0.70 to 0.76 (weighted mean = 0.73), indicating fair model discrimination (Figure 2). The overall AUC delta was 0.07. However, our estimates may possibly be favoring EWSs that use statistical modeling by virtue of their derivation in an original research population compared with aggregate-weighted EWSs that were derived externally. For example, sensitivity analysis of eCART,18 an EWS using machine learning, showed an AUC drop of 1% in a large external patient population,14 while NEWS AUCs13 dropped between 11% and 15% in two large external populations (Appendix Table 7).14,30 For hospitals adopting an externally developed EWS using statistical modeling, these results suggest that an AUC delta of approximately 5% can be expected and 7% for an internally developed EWS.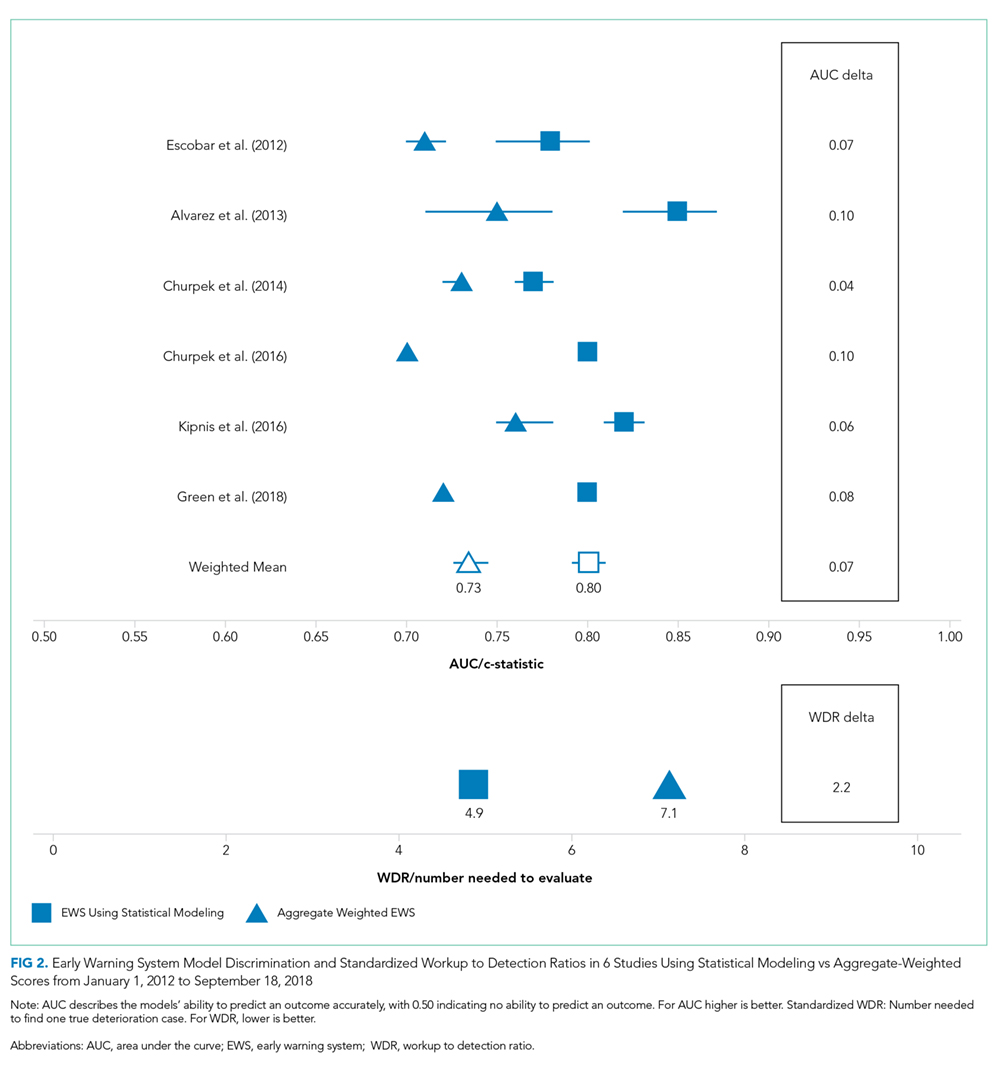
The models’ sensitivity ranged from 0.49 to 0.54 (mean = 0.51) for EWSs using statistical modeling and 0.39 to 0.50 (mean = 0.43). These results were based on chosen alert volume cutoffs. Specificity ranged from 0.90 to 0.94 (mean = 0.92) in EWSs using statistical modeling compared with 0.83 to 0.93 (mean = 0.89) in aggregate-weighted EWS models. At the 0.51 sensitivity level (mean sensitivity of reported EWSs using statistical modeling), aggregate-weighted EWSs would have an estimated specificity of approximately 0.87. Conversely, to reach a specificity of 0.92 (mean specificity of reported EWSs using statistical modeling, aggregate-weighted EWSs would have a sensitivity of approximately 0.42 compared with 0.50 in EWSs using statistical modeling (based on three studies reporting both sensitivity and specificity or an AUC graph).
