Statistical Modeling and Aggregate-Weighted Scoring Systems in Prediction of Mortality and ICU Transfer: A Systematic Review


BACKGROUND: The clinical deterioration of patients in general hospital wards is an important safety issue. Aggregate-weighted early warning systems (EWSs) may not detect risk until patients present with acute decline.
PURPOSE: We aimed to compare the prognostic test accuracy and clinical workloads generated by EWSs using statistical modeling (multivariable regression or machine learning) versus aggregate-weighted tools.
DATA SOURCES: We searched PubMed and CINAHL using terms that described clinical deterioration and use of an advanced EWS.
STUDY SELECTION: The outcome was clinical deterioration (intensive care unit transfer or death) of adult patients on general hospital wards. We included studies published from January 1, 2012 to September 15, 2018.
DATA EXTRACTION: Following 2015 PRIMSA systematic review protocol guidelines; 2015 TRIPOD criteria for predictive model evaluation; and the Cochrane Collaboration guidelines, we reported model performance, adjusted positive predictive value (PPV), and conducted simulations of workup-to-detection ratios.
DATA SYNTHESIS: Of 285 articles, six studies reported the model performance of advanced EWSs, and five were of high quality. All EWSs using statistical modeling identified at-risk patients with greater precision than aggregate-weighted EWSs (mean AUC 0.80 vs 0.73). EWSs using statistical modeling generated 4.9 alerts to find one true positive case versus 7.1 alerts in aggregate-weighted EWSs; a nearly 50% relative workload increase for aggregate-weighted EWSs.
CONCLUSIONS: Compared with aggregate-weighted tools, EWSs using statistical modeling consistently demonstrated superior prognostic performance and generated less workload to identify and treat one true positive case. A standardized approach to reporting EWS model performance is needed, including outcome definitions, pretest probability, observed and adjusted PPV, and workup-to-detection ratio.
© 2019 Society of Hospital Medicine
METHODS
Search Strategy
Adhering to PRISMA protocol guidelines for systematic reviews, we searched the peer-reviewed literature in PubMed and CINAHL Plus, as well as conference proceedings and online repositories of patient safety organizations published between January 1, 2012 and September 15, 2018. We selected this timeframe because EWSs using statistical modeling are relatively new approaches compared with the body of evidence concerning aggregate-weighted EWSs. An expert PhD researcher confirmed the search results in a blinded independent query.
Inclusion and Exclusion Criteria
We included peer-reviewed articles reporting the area under the receiver operator curve (AUC),20 or the equivalent c-statistic, of models predicting clinical deterioration (measured as the composite of transfer to intensive care unit (ICU) and/or mortality) among adult patients in general hospital wards. We excluded studies if they did not compare an EWS using statistical modeling with an aggregate-weighted EWS, did not report AUC, or only reported on an aggregate-weighted EWS. Excluded settings were pediatrics, obstetrics, emergency departments, ICUs, transitional care units, and oncology. We also excluded studies with samples limited to physiological monitoring, sepsis, or postsurgical subpopulations.
Data Abstraction
Following the TRIPOD guidelines for the reporting of predictive models,21 and the PRISMA and Cochrane Collaboration guidelines for systematic reviews,22-24 we extracted study characteristics (Table 1), sample demographics (Appendix Table 4), model characteristics and performance (Appendix Table 5), and level of scientific evidence and risk of bias (Appendix Table 6). To address the potential for overfitting, we selected model performance results of the validation dataset rather than the derivation dataset, if reported. If studies reported multiple models in either EWS category, we selected the best-performing model for comparison.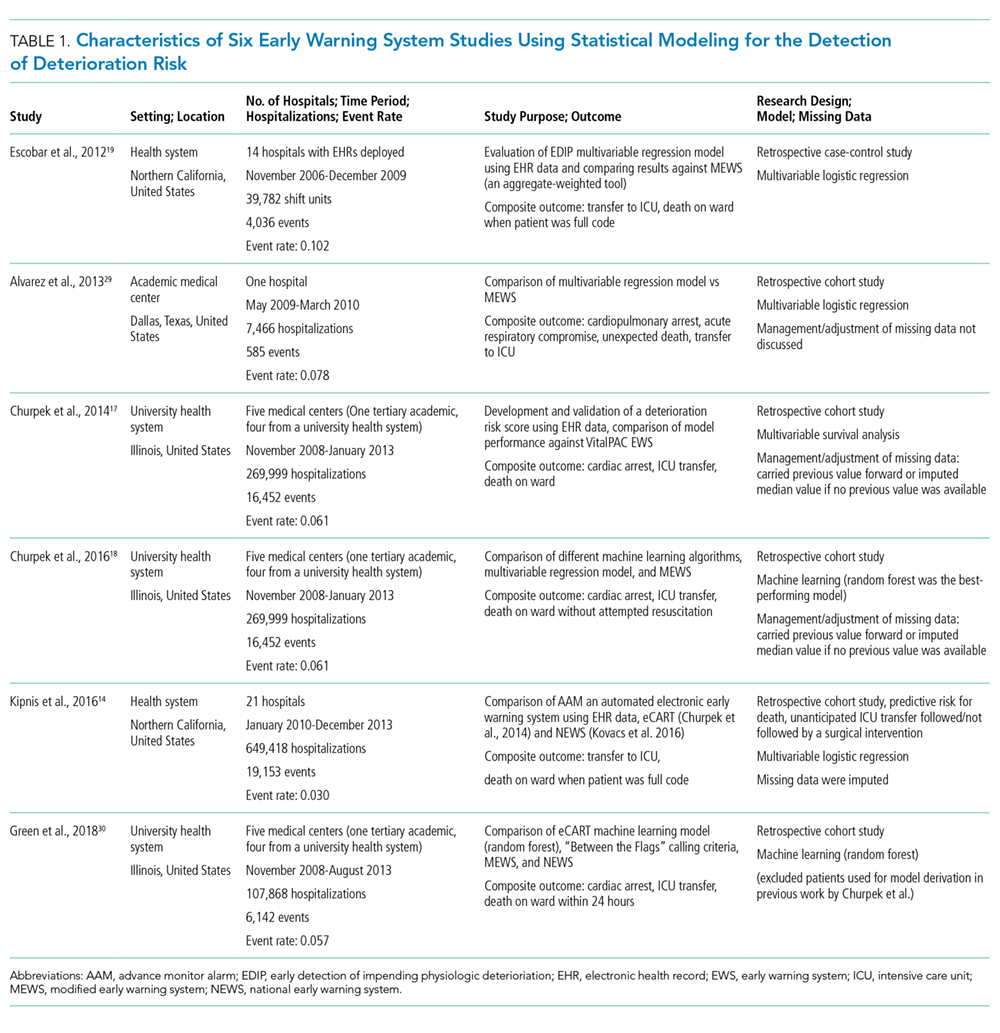
Measures of Model Performance
Because predictive models can achieve good case identification at the expense of high clinical workloads, an assessment of model performance would be incomplete without measures of clinical utility. For clinicians, this aspect can be measured as the model’s PPV (the percentage of true positive alerts among all alerts), or more intelligibly, as the WDR, which equals 1/PPV. WDR indicates the number of patients requiring evaluation to identify and treat one true positive case.9-11 It is known that differences in event rates (prevalence or pretest probability) influence a model’s PPV25 and its reciprocal WDR. However, for systematic comparison, PPV and WDR can be standardized using a fixed representative event rate across studies.24,26 We abstracted the reported PPV and WDR, and computed standardized PPV and WDR for an event rate of 4%.
Other measures included the area under the receiver operator curve (AUC),20 sensitivity, and specificity. AUC plots a model’s false positive rate (x-axis) against its true positive rate (y-axis), with an ideal scenario of very high y-values and very low x-values.27 Sensitivity (the model’s ability to detect a true positive case among all cases) and specificity (the model’s ability to detect a true noncase among all noncases28) are influenced by chosen alert thresholds. It is incorrect to assume that a given model produces only one sensitivity/specificity result; for systematic comparison, we therefore selected results in the 50% sensitivity range, and separately, in the 92% specificity range for EWSs using statistical modeling. Then, we simulated a fixed sensitivity of 0.51 and assumed specificity of 0.87 in aggregate-weighted EWSs.
