An Electronic Health Record Tool Designed to Improve Pediatric Hospital Discharge has Low Predictive Utility for Readmissions


We developed an electronic health record tool to improve pediatric hospital discharge. This tool flags children with three components that might complicate discharge: home health, polypharmacy (≥6 medications), or non-English speaking caregiver. The tool tallies components and displays them as a composite score of 0-3 points. We describe the tool’s development, implementation, and an evaluation of its predictive utility for 30-day unplanned readmissions in 29,542 discharged children. Of these children, 28% had a composite score of 1, 8% a score ≥2, and 4% were readmitted. The odds of readmission was significantly higher in children with composite score of 1 versus 0 (odds ratio [OR]: 1.7; 95% CI, 1.5-2) and ≥2 versus 0 (OR 4.2; 95% CI 3.6-4.9). The C-statistic for this model was 0.62. Despite the positive association of the score with readmission, the tool’s discriminatory performance is low. Additional research is needed to evaluate its practical benefit for improving the quality of hospital discharge.
© 2018 Society of Hospital Medicine
To generate the score, the clinical documentation of home-health orders categorizes children with home care. Each home-care equipment or service category is documented in separate flowsheet rows, allowing for identification of distinct categories (Table). Total parenteral nutrition, intravenous medications, and durable medical equipment and supplies are counted as home care. The number of discharge medications is approximated by inpatient medication orders and finalized as the number of discharge medication orders. The medications include new, historic, and as-needed medications (if included among discharge medication orders). 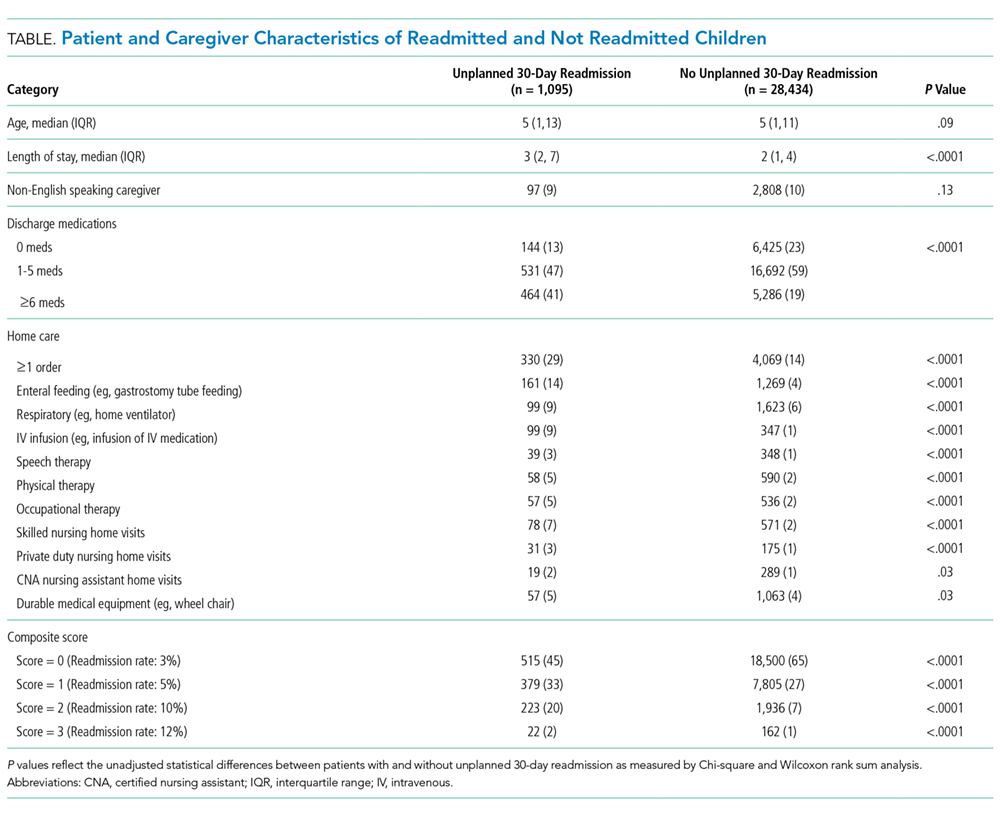
The electronic score is displayed within the EHR’s Discharge Readiness Report8 and updates automatically as relevant data are entered. The tool displays the individual components and as a composite of 0-3 points. To register a point in each category, a patient needs to exceed (1) the dichotomous discharge medications criterion (ie, ≥6 medications), (2) the dichotomous home-health order criterion (ie, ≥1 home-care order), and (3) to possess documentation of a non-English speaking caregiver. The tool serves as a visual reminder of discharge planning needs during daily coordination rounds attended by clinicians, nursing managers, case managers, and social workers. Case managers use the home-care alert to verify the accuracy of home-care orders.
Evaluation of Predictive Utility for Readmission
We performed a retrospective cohort study on patients aged 0-21 years who were discharged between January 1, 2014 and December 30, 2015. This study was performed to determine the optimal cut points for the continuous variables (discharge medications and home-care orders) and to evaluate the predictive value of the composite score.
Unplanned readmission within 30 days was used as the primary outcome. The index hospitalization was randomly selected for patients with >1 admissions to avoid biasing the results with multiple hospitalizations from individual patients.
Patient characteristics were summarized using percentages for categorical variables and the median and interquartile range (IQR) for continuous variables. We examined bivariate associations for each of the tool’s predictor elements with readmission using Chi-square and Wilcoxon tests
The area under the ROC curve (AUC) was estimated to evaluate the performance of the composite score