Limitations of Using Pediatric Respiratory Illness Readmissions to Compare Hospital Performance


BACKGROUND: Adult hospital readmission rates can reliably identify meaningful variation in hospital performance; however, pediatric condition-specific readmission rates are limited by low patient volumes.
OBJECTIVE: To determine if a National Quality Forum (NQF)-endorsed measure for pediatric lower respiratory illness (LRI) 30-day readmission rates can meaningfully identify high- and low-performing hospitals.
DESIGN: Observational, retrospective cohort analysis. We applied the pediatric LRI measure and several variations to evaluate their ability to detect performance differences.
SETTING: Administrative claims from all hospital admissions in California (2012-2014). PATIENTS: Children (age <18 years) with LRI (primary diagnosis: bronchiolitis, influenza, or pneumonia; or LRI as a secondary diagnosis with a primary diagnosis of respiratory failure, sepsis, bacteremia, or asthma).
MEASUREMENTS: Thirty-day hospital readmission rates and costs. Hierarchical regression models adjusted for age, gender, and chronic conditions were used.
RESULTS: Across all California hospitals admitting children (n = 239), using respiratory readmission rates, no outlier hospitals were identified with (1) the NQF-endorsed metric, (2) inclusion of primary asthma or secondary asthma exacerbation diagnoses, or (3) inclusion of 30-day emergency revisits. By including admissions for asthma, adding emergency revisits, and merging 3 years of data, we identified 9 outlier hospitals (2 high-performers, 7 low-performers). There was no association of hospital readmission rates with costs.
CONCLUSIONS: Using a nationally-endorsed quality measure of inpatient pediatric care, we were unable to identify meaningful variation in hospital performance without broadening the metric definition and merging multiple years of data. Utilizers of pediatric-quality measures should consider modifying metrics to better evaluate the quality of pediatric care at low-volume hospitals.
© 2018 Society of Hospital Medicine
Using the same inclusion criteria of the NQF measure but including 30-day ED revisits as an outcome, we analyzed a total of 5500 hospitalizations from 174 hospitals. The mean risk-adjusted event rate was higher at 7.9%, but there were still no outlier hospitals identified.
Using the broadened population definition (LRIA) and including 30-day ED revisits as an outcome, we analyzed a total of 8402 hospitalizations from 190 hospitals. The mean risk-adjusted event rate was 6.8%, but there were still no outlier hospitals identified.
In our final iteration, we merged 3 years of hospital data (2012-2014) using the broader population definition (LRIA) and including 30-day ED revisits as an outcome. This resulted in 27,873 admissions from 239 hospitals for this analysis, with a mean of 28 eligible hospitalizations per hospital. The mean risk-adjusted event rate was 6.7%, and this approach identified 2 high-performing (risk-adjusted rates: 3.6-5.3) and 7 low-performing hospitals (risk-adjusted rates: 10.1-15.9).
Table 2 presents the demographics of children included in this analysis. Children who had readmissions/revisits were younger, more likely to be white, less likely to have private insurance, and more likely to have a greater number of chronic conditions compared to children without readmissions/revisits.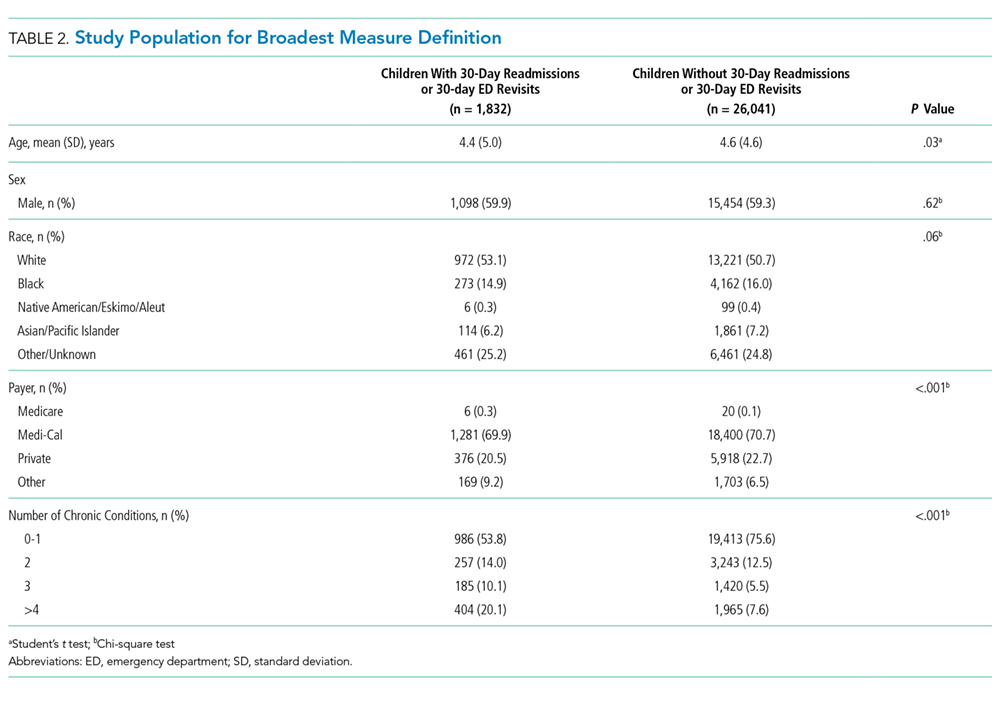
Secondary Outcome: Hospital Costs
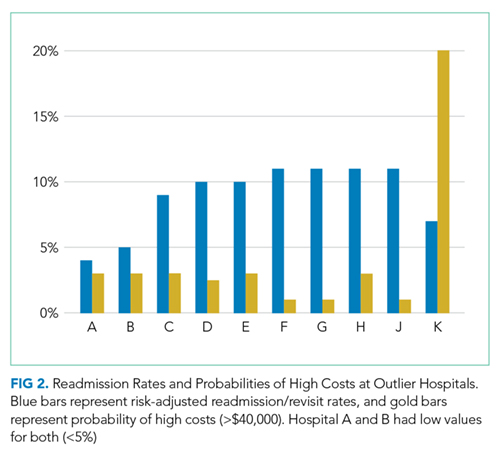
In the analysis of hospital-level costs, we found only 1 outlier high-cost hospital. There was a 20% probability of a hospital respiratory admission costing ≥$40,000 at this hospital. We found no overall relationship between hospital 30-day respiratory readmission rate and hospital costs (Figure 1). However, the hospitals that were outliers for low readmission rates also had low probabilities of excessive hospital costs (3% probability of costs >$40,000; Figure 2).
DISCUSSION
We used a nationally endorsed pediatric quality measure to evaluate hospital performance, defined as 30-day readmission rates for children with respiratory illness. We examined all-payer data from California, which is the most populous state in the country and home to 1 in 8 American children. In this large California dataset, we were unable to identify meaningful variation in hospital performance due to low hospital volumes and event rates. However, when we broadened the measure definition, we were able to identify performance variation. Our findings underscore the importance of testing and potentially modifying existing quality measures in order to more accurately capture the quality of care delivered at hospitals with lower volumes of pediatric patients.21
Our underlying assumption, in light of these prior studies, was that increasing the eligible sample in each hospital by combining respiratory diseases and by using an all-payer claims database rather than a Medicaid-only database would increase the number of detectable outlier hospitals. However, we found that these approaches did not ameliorate the limitations of small volumes. Only through aggregating data over 3 years was it possible to identify any outliers, and this approach identified only 3% of hospitals as outliers. Hence, our analysis reinforces concerns raised by several prior analyses4-7 regarding the limited ability of current pediatric readmission measures to detect meaningful, actionable differences in performance across all types of hospitals (including general/nonchildren’s hospitals). This issue is of particular concern for common pediatric conditions like respiratory illnesses, for which >70% of hospitalizations occur in general hospitals.11
Developers and utilizers of pediatric quality metrics should consider strategies for identifying meaningful, actionable variation in pediatric quality of care at general hospitals. These strategies might include our approach of combining several years of hospital data in order to reach adequate volumes for measuring performance. The potential downside to this approach is performance lag—specifically, hospitals implementing quality improvement readmissions programs may not see changes in their performance for a year or two on a measure aggregating 3 years of data. Alternatively, it is possible that the measure might be used more appropriately across a larger group of hospitals, either to assess performance for multihospital accountable care organization (ACO), or to assess performance for a service area or county. An aggregated group of hospitals would increase the eligible patient volume and, if there is an ACO relationship established, coordinated interventions could be implemented across the hospitals.
We examined the 30-day readmission rate because it is the current standard used by CMS and all NQF-endorsed readmission measures.22,23 Another potential approach is to analyze the 7- or 15-day readmission rate. However, these rates may be similarly limited in identifying hospital performance due to low volumes and event rates. An analysis by Wallace et al. of preventable readmissions to a tertiary children’s hospital found that, while many occurred within 7 days or 15 days, 27% occurred after 7 days and 22%, after 15.24 However, an analysis of several adult 30-day readmission measures used by CMS found that the contribution of hospital-level quality to the readmission rate (measured by intracluster correlation coefficient) reached a nadir at 7 days, which suggests that most readmissions after the seventh day postdischarge were explained by community- and household-level factors beyond hospitals’ control.22 Hence, though 7- or 15-day readmission rates may better represent preventable outcomes under the hospital’s control, the lower event rates and low hospital volumes likely similarly limit the feasibility of their use for performance measurement.
Pediatric quality measures are additionally intended to drive improvements in the value of pediatric care, defined as quality relative to costs.25 In order to better understand the relationship of hospital performance across both the domains of readmissions (quality) and costs, we examined hospital-level costs for care of pediatric respiratory illnesses. We found no overall relationship between hospital readmission rates and costs; however, we found 2 hospitals in California that had significantly lower readmission rates as well as low costs. Close examination of hospitals such as these, which demonstrate exceptional performance in quality and costs, may promote the discovery and dissemination of strategies to improve the value of pediatric care.12
Our study had several limitations. First, the OSHPD database lacked detailed clinical variables to correct for additional case-mix differences between hospitals. However, we used the approach of case-mix adjustment outlined by an NQF-endorsed national quality metric.8 Secondly, since our data were limited to a single state, analyses of other databases may have yielded different results. However, prior analyses using other multistate databases reported similar limitations,5,6 likely due to the limitations of patient volume that are generalizable to settings outside of California. In addition, our cost analysis was performed using cost-to-charge ratios that represent total annual expenses/revenue for the whole hospital.16 These ratios may not be reflective of the specific services provided for children in our analysis; however, service-specific costs were not available, and cost-to-charge ratios are commonly used to report costs.
