Limitations of Using Pediatric Respiratory Illness Readmissions to Compare Hospital Performance


BACKGROUND: Adult hospital readmission rates can reliably identify meaningful variation in hospital performance; however, pediatric condition-specific readmission rates are limited by low patient volumes.
OBJECTIVE: To determine if a National Quality Forum (NQF)-endorsed measure for pediatric lower respiratory illness (LRI) 30-day readmission rates can meaningfully identify high- and low-performing hospitals.
DESIGN: Observational, retrospective cohort analysis. We applied the pediatric LRI measure and several variations to evaluate their ability to detect performance differences.
SETTING: Administrative claims from all hospital admissions in California (2012-2014). PATIENTS: Children (age <18 years) with LRI (primary diagnosis: bronchiolitis, influenza, or pneumonia; or LRI as a secondary diagnosis with a primary diagnosis of respiratory failure, sepsis, bacteremia, or asthma).
MEASUREMENTS: Thirty-day hospital readmission rates and costs. Hierarchical regression models adjusted for age, gender, and chronic conditions were used.
RESULTS: Across all California hospitals admitting children (n = 239), using respiratory readmission rates, no outlier hospitals were identified with (1) the NQF-endorsed metric, (2) inclusion of primary asthma or secondary asthma exacerbation diagnoses, or (3) inclusion of 30-day emergency revisits. By including admissions for asthma, adding emergency revisits, and merging 3 years of data, we identified 9 outlier hospitals (2 high-performers, 7 low-performers). There was no association of hospital readmission rates with costs.
CONCLUSIONS: Using a nationally-endorsed quality measure of inpatient pediatric care, we were unable to identify meaningful variation in hospital performance without broadening the metric definition and merging multiple years of data. Utilizers of pediatric-quality measures should consider modifying metrics to better evaluate the quality of pediatric care at low-volume hospitals.
© 2018 Society of Hospital Medicine
For our primary analysis of 30-day hospital readmission rates, we used hierarchical logistic regression models with hospitals as random effects, adjusting for patient age, sex, and the presence and number of body systems affected by chronic conditions.8 These 4 patient characteristics were selected by the NQF measure developers “because distributions of these characteristics vary across hospitals, and although they are associated with readmission risk, they are independent of hospital quality of care.”10
Because the Centers for Medicare and Medicaid Services (CMS) are in the process of selecting pediatric quality measures for meaningful use reporting,18 we utilized CMS hospital readmissions methodology to calculate risk-adjusted rates and identify outlier hospitals. The CMS modeling strategy stabilizes performance estimates for low-volume hospitals and avoids penalizing these hospitals for high readmission rates that may be due to chance (random effects logistic model to obtain best linear unbiased predictions). This is particularly important in pediatrics, given the low pediatric volumes in many hospitals admitting children.4,19 We then identified outlier hospitals for the 30-day readmission rate using CMS methodology (hospital’s adjusted readmission rate confidence interval does not overlap the overall group mean rate).5, 4 CMS uses this approach for public reporting on HospitalCompare.20
Sensitivity Analyses
We tested several broadening variations of the NQF measure: (1) addition of children admitted with a primary diagnosis of asthma (without requiring LRI as a secondary diagnosis) or a secondary diagnosis of asthma exacerbation (LRIA), (2) inclusion of 30-day ED revisits as an outcome, and (3) merging of 3 years of data. These analyses were all performed using the same modeling strategy as in our primary analysis.
Secondary Outcome Analyses
Our analysis of hospital costs used costs for index admissions over 3 years (2012–2014) and included admissions for asthma. We used hierarchical regression models with hospitals as random effects, adjusting for age, gender, and the presence and number of chronic conditions. The distribution of cost values was highly skewed, so ordinal models were selected after several other modeling approaches failed (log transformation linear model, gamma model, Poisson model, zero-truncated Poisson model).
The relationship between hospital-level costs and hospital-level 30-day readmission or ED revisit rates was analyzed using Spearman’s rank correlation coefficient. Statistical analysis was performed using SAS version 9.4 software (SAS Institute; Cary, North Carolina).
RESULTS
Primary Analysis of 30-day Readmissions (per National Quality Forum Measure)
Our analysis of the 2014 OSHPD database using the specifications of the NQF Pediatric LRI Readmission Measure included a total of 5550 hospitalizations from 174 hospitals, with a mean of 12 eligible hospitalizations per hospital. The mean risk-adjusted readmission rate was 6.5% (362 readmissions). There were no hospitals that were considered outliers based on the risk-adjusted readmission rates (Table 1).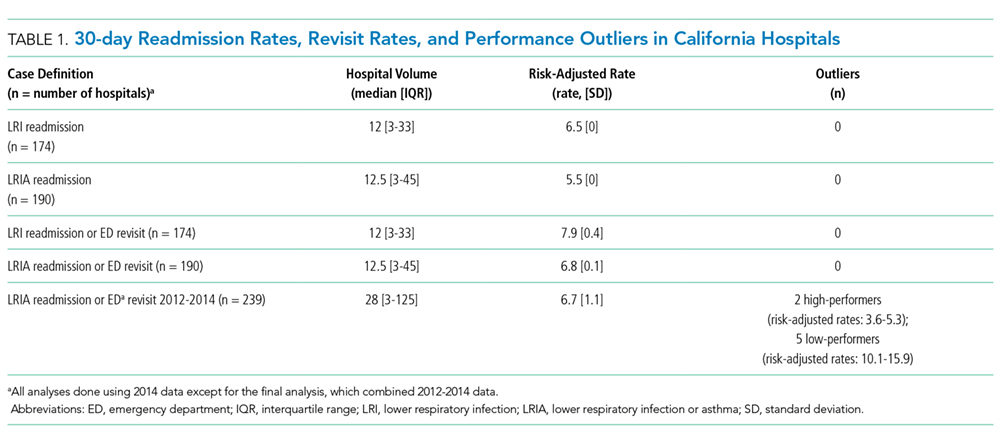
Sensitivity Analyses (Broadening Definitions of National Quality Forum Measure)
We report our testing of the broadened variations of the NQF measure in Table 1. Broadening the population to include children with asthma as a primary diagnosis and children with asthma exacerbations as a secondary diagnosis (LRIA) increased the size of our analysis to 8402 hospitalizations from 190 hospitals. The mean risk-adjusted readmission rate was 5.5%, and no outlier hospitals were identified.
