Development of Hospitalization Resource Intensity Scores for Kids (H-RISK) and Comparison across Pediatric Populations


BACKGROUND: In the Medicare population, measures of relative severity of illness (SOI) for hospitalized patents have been used in prospective payment models. Similar measures for pediatric populations have not been fully developed.
OBJECTIVE: To develop hospitalization resource intensity scores for kids (H-RISK) using pediatric relative weights (RWs) for SOI and to compare hospital types on case-mix index (CMI).
DESIGN/METHODS: Using the 2012 Kids’ Inpatient Database (KID), we developed RWs for each All Patient Refined Diagnosis Related Group (APR-DRG) and SOI level. RW corresponded to the ratio of the adjusted mean cost for discharges in an APR-DRG SOI combination over adjusted mean cost of all discharges in the dataset. RWs were applied to every discharge from 3,117 hospitals in the database with at least 20 discharges. RWs were then averaged at the hospital level to provide each hospital’s CMI. CMIs were compared by hospital type using Kruskal–Wallis tests.
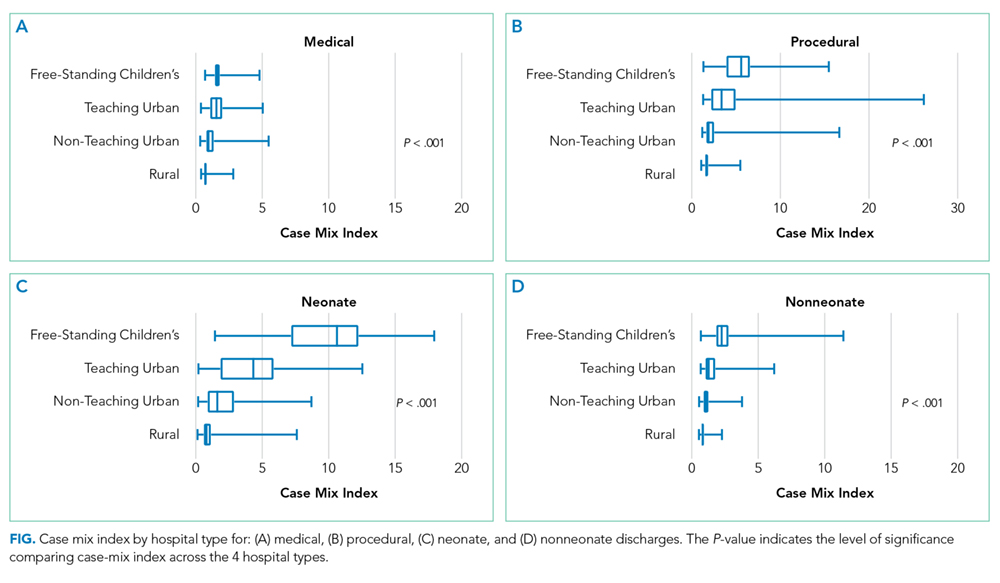
RESULTS: The overall adjusted mean cost of weighted discharges in Healthcare Cost and Utilization Project KID 2012 was $6,135 per discharge. Solid organ and bone marrow transplantations represented 4 of the 10 highest procedural RWs (range: 35.5 to 91.7). Neonatal APR-DRG SOIs accounted for 8 of the 10 highest medical RWs (range: 19.0 to 32.5). Free-standing children’s hospitals yielded the highest median (interquartile range [IQR]) CMI (2.7 [2.2–3.1]), followed by urban teaching hospitals (1.8 [1.3–2.6]), urban nonteaching hospitals (1.1 [0.9–1.5]), and rural hospitals (0.8 [0.7–0.9]; P < .001).
CONCLUSION: H-RISK for populations of pediatric admissions are sensitive to detection of substantial differences in SOI by hospital type.
© 2018 Society of Hospital Medicine
H-RISK Generation
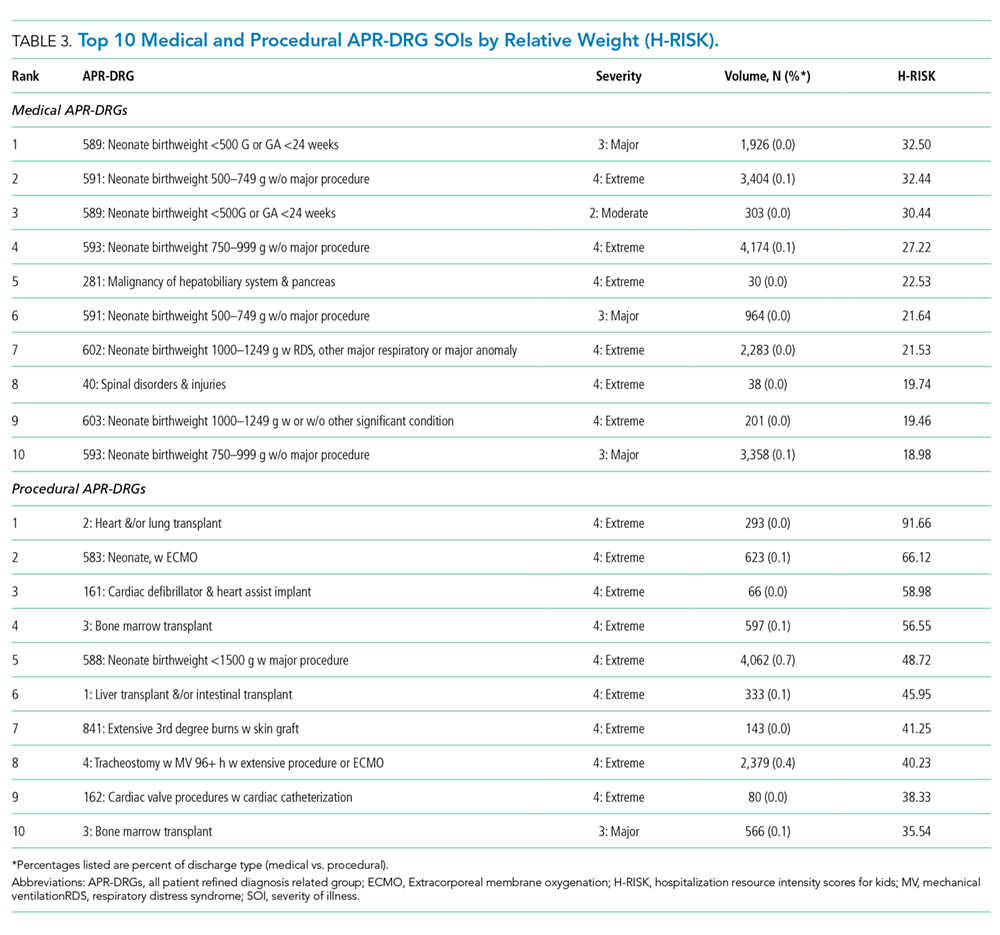
The weighted Winsorized mean cost of all discharges was $6,135 per discharge. The majority of cost-based H-RISK were higher than 1, with 1,038 (82.5%) of APR-DRG SOIs incurring an estimated cost higher than $6,135. Solid organ and bone marrow transplantations represented 4 of the 10 highest cost-based RWs for procedural APR-DRG SOIs (Table 3). Neonatal APR-DRG SOIs accounted for 8 of the 10 highest medical RWs. A list of all APR-DRG SOIs and H-RISK can be found in Appendix A.
Hospital-Level Case-Mix Index for Acute Hospitalizations
After excluding normal newborn and maternal hospitalizations, median CMI of the 3117 hospitals with at least 20 unweighted discharges was 1.0 (interquartile range [IQR]: 0.8, 1.7). CMI varied significantly across hospital types (P < .001). Free-standing children’s hospitals exhibited the highest cost-based CMI (median: 2.7, IQR: 2.2–3.1), followed by urban teaching hospitals (median: 1.8, IQR: 1.3–2.6), urban nonteaching hospitals (median: 1.1, IQR: 0.9–1.5), and rural hospitals (median: 0.9, IQR: 0.7–0.9).
DISCUSSION
Currently, no widely available measures can compare the relative intensity of hospital care specific for inpatient pediatric populations. To meet this important need, we have developed a methodology to determine valid pediatric RWs (H-RISK) which can be used to estimate the intensity of care for applications across entire hospital patient populations and specific subpopulations. H-RISK allow calculation of CMIs for risk adjustment of various outcomes at the discharge- or hospital-level and for comparisons among hospitals and populations. Using this methodology, we demonstrated that the CMI for free-standing children’s hospitals was significantly higher than those of rural, urban, nonteaching and urban teaching hospitals for all discharges and medical or procedural subgroups.
CMS has used RWs based on DRGs since the inception of the prospective payment system in 1983. The sequence of DRGs used by CMS has purposely focused on older adult Medicare population, and CMS itself recommends applying Medicare-focused DRGs (MS-DRGs being the current iteration) only for the >65 year population.6 Nevertheless, many payers, both government and commercial, utilize MS-DRGs and their RWs for payment purposes when reimbursing children’s hospitals. The validity of using weights developed using this grouper in hospitals treating large numbers of pediatric patients and childhood illnesses has been called into question, particularly when such weights are used in reimbursement of children’s hospitals.7
Several factors contribute to the validity of a model for developing RWs. First, the system used to describe patient hospitalizations and illnesses should be appropriate to the population in question. As described above, the original DRG system and its subsequent iterations were designed to describe hospitalizations for adults >65 years of age.8, 9 Over the years, CMS DRGs incorporated rudimentary categories for neonatal and obstetrical hospitalizations. Still, the current MS-DRGs lack sufficient focus on common inpatient pediatric conditions to adequately describe pediatric hospitalizations, particularly those in free-standing children’s hospitals delivering tertiary and quaternary care. Thus, a more appropriate classification schema for developing RWs specific for pediatric hospitalization should include patients across the entire age spectrum. APR-DRGs represent one such classification system.
Once an appropriate patient classification system is selected, then the population of hospitalized patients to be used as the reference group becomes important. For a system targeting a pediatric inpatient population, a hospital discharge database representing a broad sample of pediatric hospitalizations offers the best basis for developing a system of weights applicable to different types of hospitals providing care for children. For this purpose, we selected the 2012 KID database, a nationally representative dataset containing data on newborn and pediatric discharges from the majority of states within the US. This choice assured that the RWs developed were based on and applicable to pediatric hospitalizations across the entire spectrum of SOI and resource intensity.
A number of measures of hospital performance and quality have been developed and are used by various entities, including individual hospitals, CMS, Leapfrog, Magnet, Joint Commission, and payers, for purposes ranging from benchmarking for improvement to payment models to reimbursement penalties. However, SOI of a hospital’s patient population influences not only the intensity of care that a hospital provides but also presents a potential impact on process and outcome measures. Thus, fair and appropriate measures must consider differences in SOI when comparing hospital performances. Using the weights derived in this paper, these adjustments can be possibly made at either the discharge- or hospital-level, depending on the application, and may include comparisons by hospital location, ownership, payer mix, or socioeconomic strata.
It is also common for hospitals to quantitatively express the uniqueness of services that they deliver to payers or the general public. A hospital-level CMI (derived as the average discharge weight for patients within a hospital) is one way that hospitals may differentiate themselves. This can be accomplished by considering the ratio of one hospital’s CMI to another hospital’s (or an average of a group of hospitals) as an expression of the relative intensity of services. For example, if hospital x has a CMI of 2.3, and hospital y has a CMI of 1.4, the population of children hospitalized at hospital x was 64.3% (1–2.3/1.4) more resource intensive than the children seen at hospital y.
This study should be considered in terms of several limitations. We used costs as the basis for determining intensity of service. Thus, the difference in cost structure among children’s hospitals and between children’s hospitals and other hospital types in the KID could have affected the final calculated weights. Also, the RWs calculated in this study rely on hospital discharge data. Thus, complications which were not “present on admission” and occurred during a hospitalization could have reflected poor quality of care yet still increase resource intensity as measured by total costs. Future studies should examine the potential impact of using present-on-admission diagnoses only for the APR-DRG grouping on the values of RWs. Significant variation may have existed among hospitals in resource utilization, and some hospitals may have exhibited significant overutilization of resources for the same conditions. However, as we used Winsorized means, the impact of potential outliers should have been reduced. Some APR-DRG-SOI combinations were seen mainly at children’s hospitals. Thus, cost structure and resource utilization practices of this subset of hospitals would have been the only contributors to weights for these patients. Given that the 2012 KID contained a broad representation of pediatric hospitalizations, with age 0–20 years, newborns accounted for the majority of total cases in the database. While providing a full range of pediatric weights, inclusion of these patients lowered the overall average RW. For this reason, we excluded normal newborn categories and maternal categories from analysis of CMI across hospital types and focused on acute-care hospitalizations. Lastly, as with any study relying on administrative data, there is always the possibility of coding errors or data entry errors in the reference dataset.
