Development of Hospitalization Resource Intensity Scores for Kids (H-RISK) and Comparison across Pediatric Populations


BACKGROUND: In the Medicare population, measures of relative severity of illness (SOI) for hospitalized patents have been used in prospective payment models. Similar measures for pediatric populations have not been fully developed.
OBJECTIVE: To develop hospitalization resource intensity scores for kids (H-RISK) using pediatric relative weights (RWs) for SOI and to compare hospital types on case-mix index (CMI).
DESIGN/METHODS: Using the 2012 Kids’ Inpatient Database (KID), we developed RWs for each All Patient Refined Diagnosis Related Group (APR-DRG) and SOI level. RW corresponded to the ratio of the adjusted mean cost for discharges in an APR-DRG SOI combination over adjusted mean cost of all discharges in the dataset. RWs were applied to every discharge from 3,117 hospitals in the database with at least 20 discharges. RWs were then averaged at the hospital level to provide each hospital’s CMI. CMIs were compared by hospital type using Kruskal–Wallis tests.
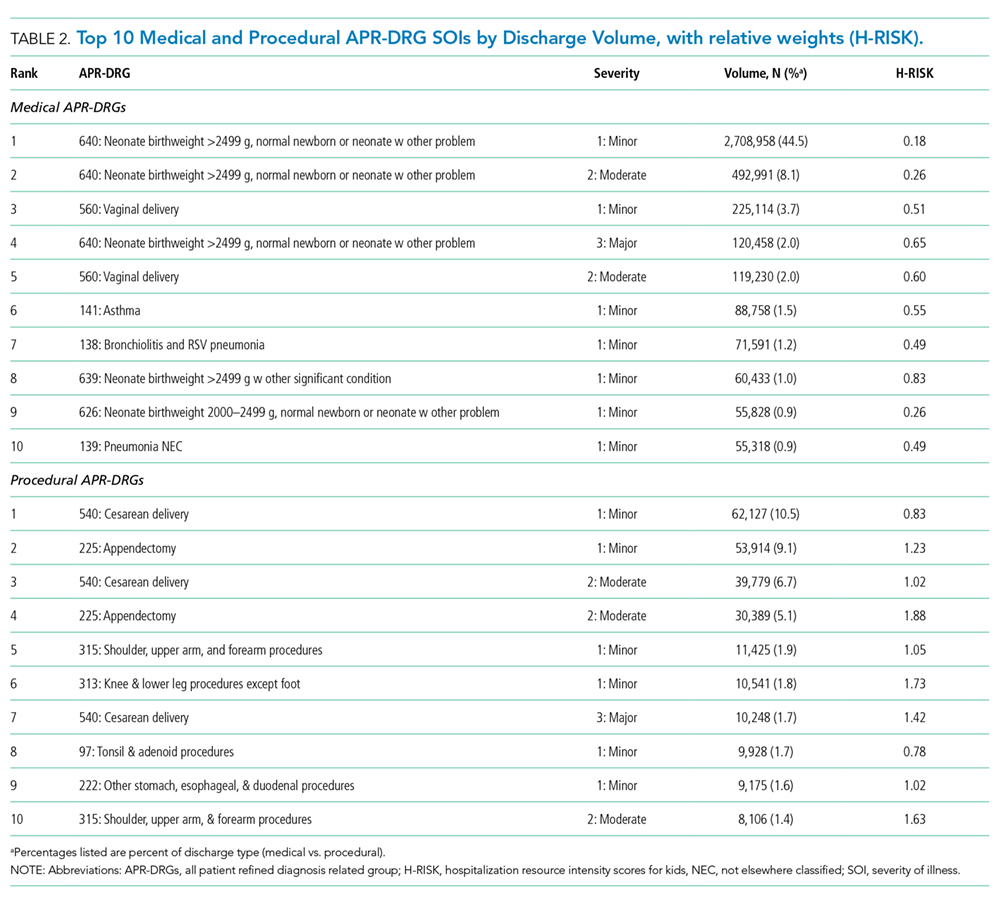
RESULTS: The overall adjusted mean cost of weighted discharges in Healthcare Cost and Utilization Project KID 2012 was $6,135 per discharge. Solid organ and bone marrow transplantations represented 4 of the 10 highest procedural RWs (range: 35.5 to 91.7). Neonatal APR-DRG SOIs accounted for 8 of the 10 highest medical RWs (range: 19.0 to 32.5). Free-standing children’s hospitals yielded the highest median (interquartile range [IQR]) CMI (2.7 [2.2–3.1]), followed by urban teaching hospitals (1.8 [1.3–2.6]), urban nonteaching hospitals (1.1 [0.9–1.5]), and rural hospitals (0.8 [0.7–0.9]; P < .001).
CONCLUSION: H-RISK for populations of pediatric admissions are sensitive to detection of substantial differences in SOI by hospital type.
© 2018 Society of Hospital Medicine
For every APR-DRG SOI combinations available in the 2012 KID, calculation of RW was based on the ratio of the mean cost for patients assigned to a particular APR-DRG SOI compared with the mean cost for all patients in the database. Inpatient costs less than $0.50 were set to missing and removed from analysis. Mortalities and discharges with missing CCR and wage index values were also excluded from analysis. We required that estimates for RWs be based on a reasonable set of data (ie, 10 or more discharges) for each APR-DRG SOI, and that estimates across the 4 SOI levels within an APR-DRG be monotonically nondecreasing (ie, as SOI level increases, weights must either be the same or increasing). Winsorized means were used as point estimates for mean cost in both the numerator and denominator of RW computation. Winsorizing refers to an analytic transformation by which the influence of outliers (eg, values beyond a certain threshold) is mitigated by replacing the value of outliers with the value of the threshold. We used the 5th and 95th percentiles as thresholds for Winsorizing our point estimates.
Winsorized point estimates failing to meet the minimum sample size of 10 or nondecreasing monotonicity requirement were modified by one of the two following methods:
- Cost data were modeled using a generalized linear model assuming an exponential distribution. Covariates in the model included APR-DRG and SOI within APR-DRG as a continuous variable. Where applicable, Winsorized estimates of the mean were replaced with modeled estimates.
- Data from an APR-DRG SOI in question were combined with other SOIs within the same APR-DRG with the closest Winsorized mean value. Once data were combined, a common Winsorized value was re-computed and values across SOIs were checked to ensure that nondecreasing monotonicity was maintained. In some APR-DRGs with sparse data, this involved combining pairs of severity levels; in others, it involved combining three or four severity levels together.
For APR-DRGs in which no discharges at any SOI were recorded in the 2012 KID, we used the Winsorized mean of all encounters with a common major diagnostic category (MDC) as the missing APR-DRG as point estimate for all 4 SOI levels.
To calculate the CMI for a set of discharges (eg, discharges at a hospital in a year), RWs were assigned to each discharge based on APR-DRG SOI designation. Consequently, all discharges from a specific APR-DRG SOI were assigned the same RW. Once RWs were assigned, CMI was calculated as the mean RW across all discharges. To compare hospital types based on acute-care hospital stays which are usually considered with the realm of pediatric care, we excluded RWs for normal newborns, defined as APR-DRG 626 (neonate birthweight of 2000–2499 g, normal newborn or neonate with other problems) and 640 (neonate birthweight >2499 g, normal newborn or neonate with other problems), and maternal hospitalizations, defined as APR-DRG 540 (cesarean delivery) and 560 (vaginal delivery), from our CMI calculations.
Statistical Methodology
Categorical variables were summarized using frequencies and percentages; continuous variables were summarized using medians and interquartile ranges. Differences between hospital
types (eg, rural, urban nonteaching, urban teaching, and
free-standing) were assessed using a Chi-square test for association for categorical variables. Differences in continuous variables including comparisons of neonatal (MDC 15) and nonneonatal discharges, and medical versus procedural discharges as defined by the APR-DRG grouper were assessed using a Kruskal–Wallis test. All analyses were performed using SAS, Version 9.4 (SAS Institute, Cary, North Carolina); P values <.05 were considered statistically significant.
This study was considered nonhuman subjects research by the Institutional Review Board of Vanderbilt University Medical Center.
RESULTS
Patient Population
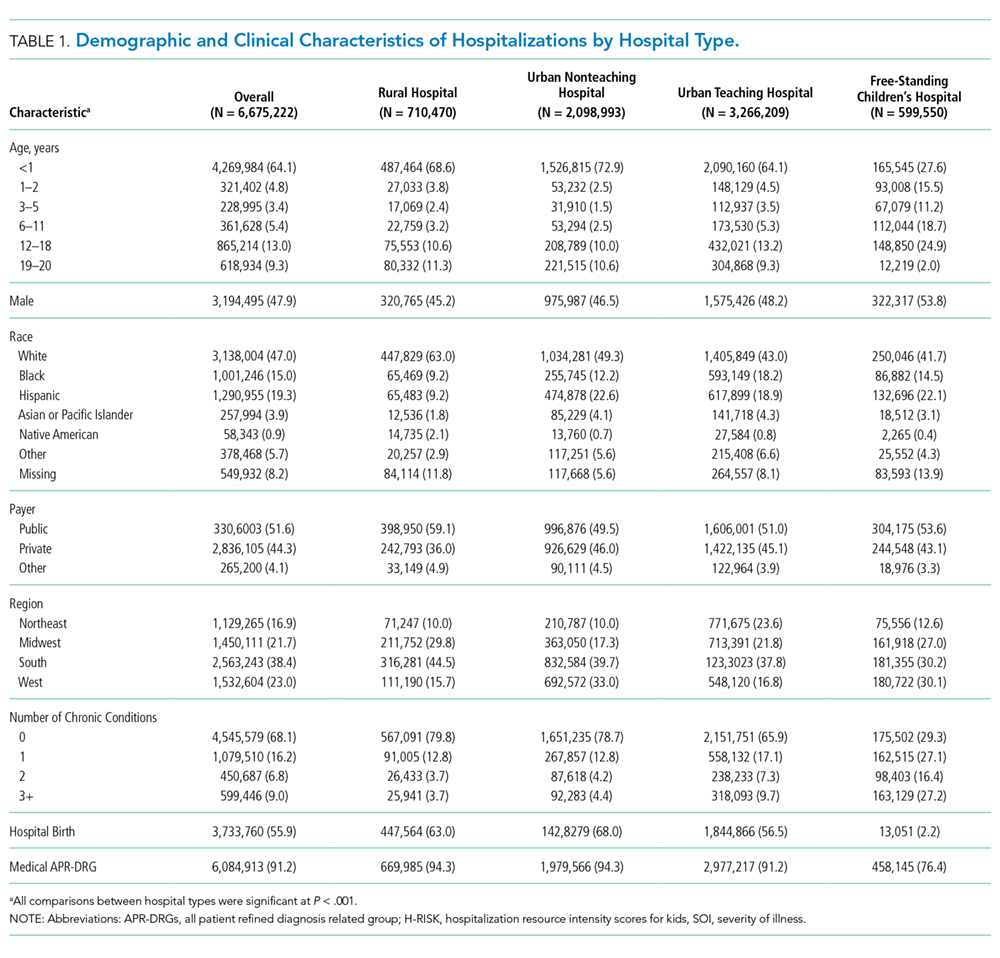
Table 1 summarizes the patient characteristics for all 4 hospital types. All comparisons of patient characteristics across the four hospital types are significant (P < .001). Of the 6,675,222 weighted discharges in HCUP KID 2012, almost two-thirds were less than one year old (4,269,984). Three-quarters of those infant discharges (3,733,760) were in-hospital births. The South was the Census region with the most number of discharges (38.8%), and over half of discharges (53.2%) included patients who lived in metro areas with more than 1 million residents. Patients disproportionately originated from lower-income areas with 30.9% living in zip codes with median incomes in the first quartile.