Returns to Emergency Department, Observation, or Inpatient Care Within 30 Days After Hospitalization in 4 States, 2009 and 2010 Versus 2013 and 2014


BACKGROUND: Nationally, readmissions have declined for acute myocardial infarction (AMI) and heart failure (HF) and risen slightly for pneumonia, but less is known about returns to the hospital for observation stays and emergency department (ED) visits. Objective: To describe trends in rates of 30-day, all-cause, unplanned returns to the hospital, including returns for observation stays and ED visits. Design: By using Healthcare Cost and Utilization Project data, we compared 210,007 index hospitalizations in 2009 and 2010 with 212,833 matched hospitalizations in 2013 and 2014. Setting: Two hundred and one hospitals in Georgia, Nebraska, South Carolina, and Tennessee. Patients: Adults with private insurance, Medicaid, or no insurance and seniors with Medicare who were hospitalized for AMI, HF, and pneumonia. Measurements: Thirty-day hospital return rates for inpatient, observation, and ED visits. RESULTS: Return rates remained stable among adults with private insurance (15.1% vs 15.3%; P = 0.45) and declined modestly among seniors with Medicare (25.3% vs 25.0%; P = 0.04). Increases in observation and ED visits coincided with declines in readmissions (8.9% vs 8.2% for private insurance and 18.3% vs 16.9% for Medicare, both P ≤ 0.001). Return rates rose among patients with Medicaid (31.0% vs 32.1%; P = 0.04) and the uninsured (18.8% vs 20.1%; P = 0.004). Readmissions remained stable (18.7% for Medicaid and 9.5% for uninsured patients, both P > 0.75) while observation and ED visits increased. CONCLUSIONS: Total returns to the hospital are stable or rising, likely because of growth in observation and ED visits. Hospitalists’ efforts to improve the quality and value of hospital care should consider observation and ED care.
© 2017 Society of Hospital Medicine
Statistical Analysis
To compare rates at which patients returned to the hospital during 2 cohort periods (2009 and 2010 vs 2013 and 2014), we used coarsened exact matching, a well-established matching technique for balancing covariates between 2 populations of patients that may be related to the outcome.23 For observational datasets, coarsened exact matching is preferable to traditional matching because it enables the investigator to assess balance between the 2 populations, select the desired degree of balance, and eliminate observations for which comparable matches cannot be found.
We assembled sets of index admissions in each study period that were similar with respect to payer, primary diagnosis, and other factors. Matching variables included the patient’s age group, sex, and Elixhauser Comorbidity Index24 (in deciles), as well as the hospital’s ratio of observation visits relative to inpatient admissions in 2009 and 2010 combined (in quartiles; see supplementary Appendix). For Medicare beneficiaries, we also matched on dual enrollment in Medicaid.
We conducted the matching process separately for each target condition and payer population. First, we grouped index admissions in both periods into strata defined by all possible combinations of the matching variables and allowing one-to-many random matching within strata. We then dropped records in any strata for which there were no records in 1 of the time periods. Finally, we calculated weights based on the size of each stratum. We used these weights to account for the different numbers of index admissions in each stratum between the 2 study periods. For example, if a stratum contained 10 index admissions in 2009 and 2010 combined and 20 in 2013 and 2014 combined, an admission weighed double in the earlier period. After weighting, the index admissions in each period (2009 and 2010; 2013 and 2014) had similar characteristics (Table 1).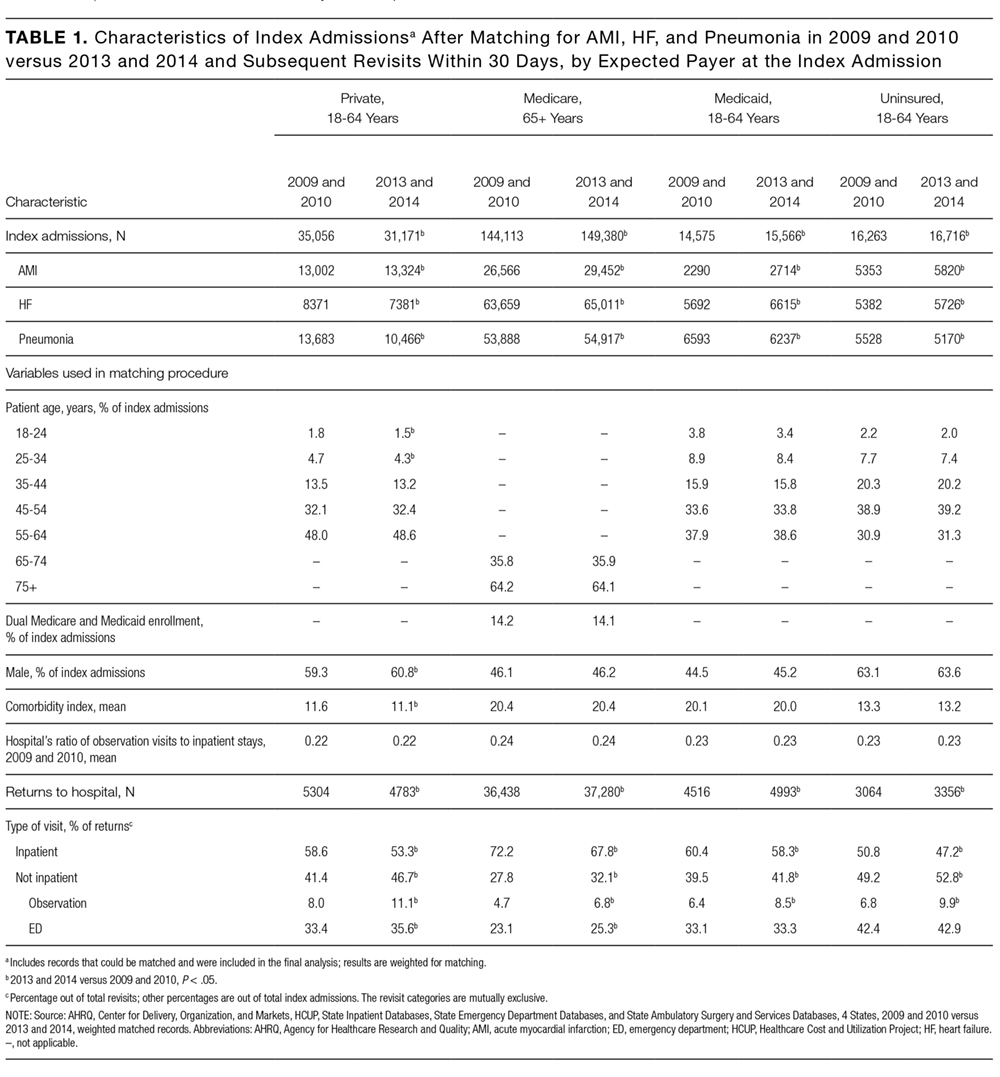
RESULTS
There were 423,503 eligible index admissions for AMI, HF, and pneumonia in the 2 periods combined; 422,840 (99.8%) were successfully matched and included in this analysis. After matching weights were applied, there were few statistically significant differences across the 2 time periods (see Table 1 and supplementary Appendix).
From 2009 and 2010 to 2013 and 2014, the percentage of patients hospitalized for AMI, HF, and pneumonia who had only observation or ED visits when they returned to the hospital increased from 41.4% to 46.7% among patients with private insurance (P < 0.001), from 27.8% to 32.1% among older patients with Medicare (P < 0.001), from 39.5% to 41.8% among patients with Medicaid (P = 0.03), and from 49.2% to 52.8% among patients without insurance (P = 0.004; Table 1). The percentage of returns to the hospital for observation increased across all payers (P < 0.001); in 2013 and 2014 combined, observation visits ranged from 6.8% of hospital returns among patients with Medicare to 11.1% among patients with private insurance. The percentage of returns to the hospital for an ED visit increased among patients with private insurance (P = 0.02) and Medicare (P < 0.001); in 2013 and 2014, ED visits ranged from 25.3% of returns to the hospital among patients with Medicare to 42.9% among uninsured patients.
The increases in 30-day observation and ED visits coincided with reductions in inpatient readmissions among patients with private insurance and Medicare and contributed to growth in total returns to the hospital among patients with Medicaid or no insurance (Figure 1).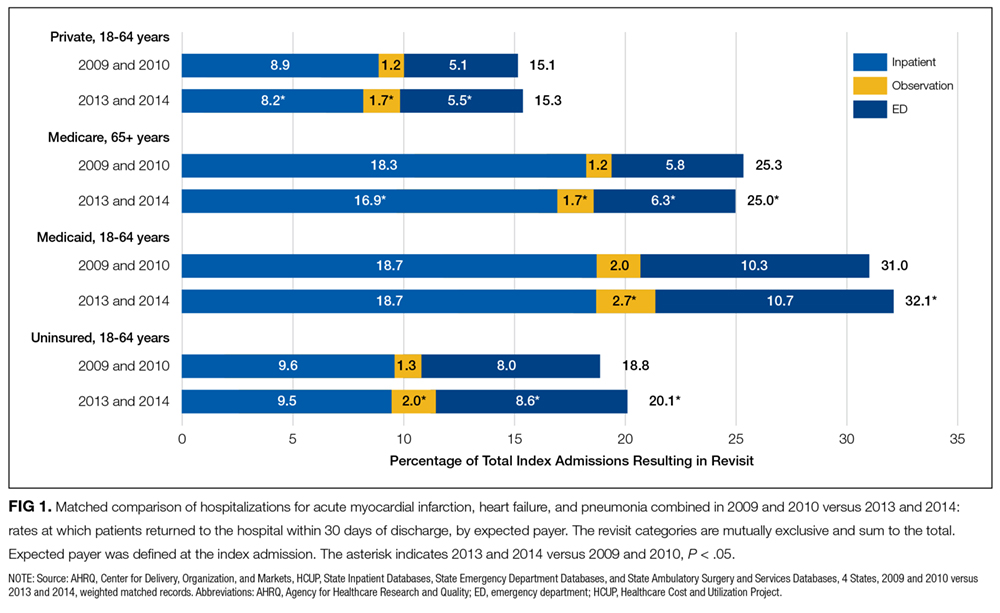
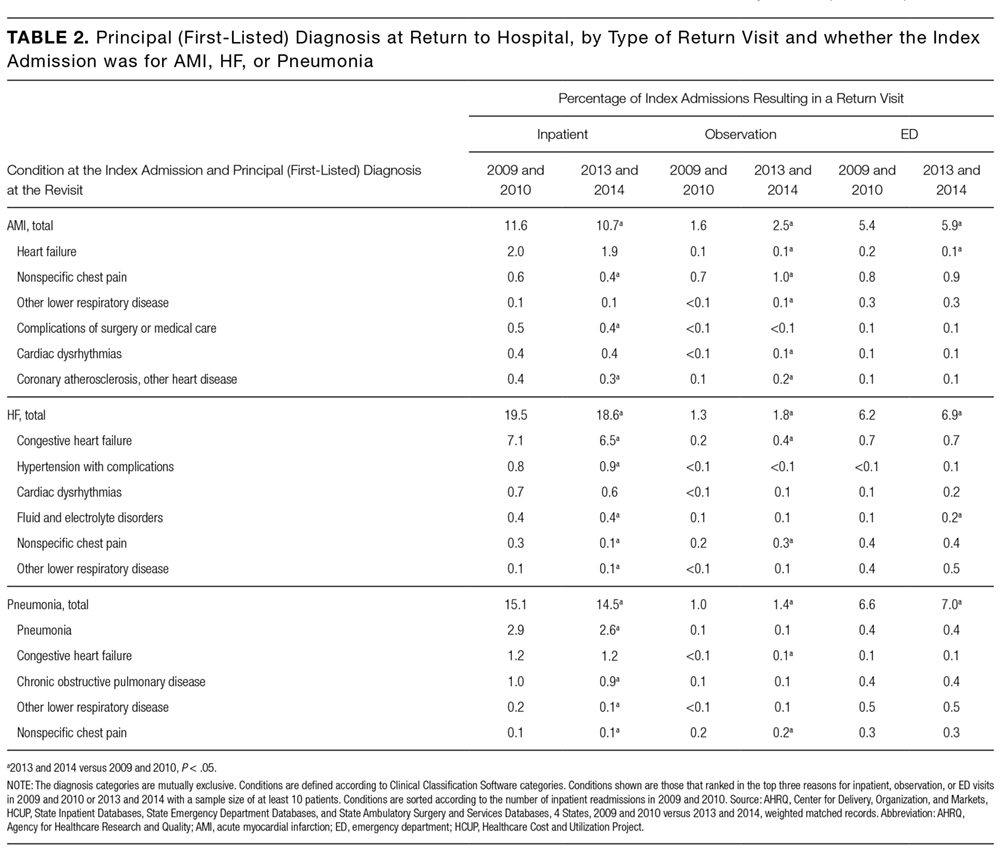
Figure 2 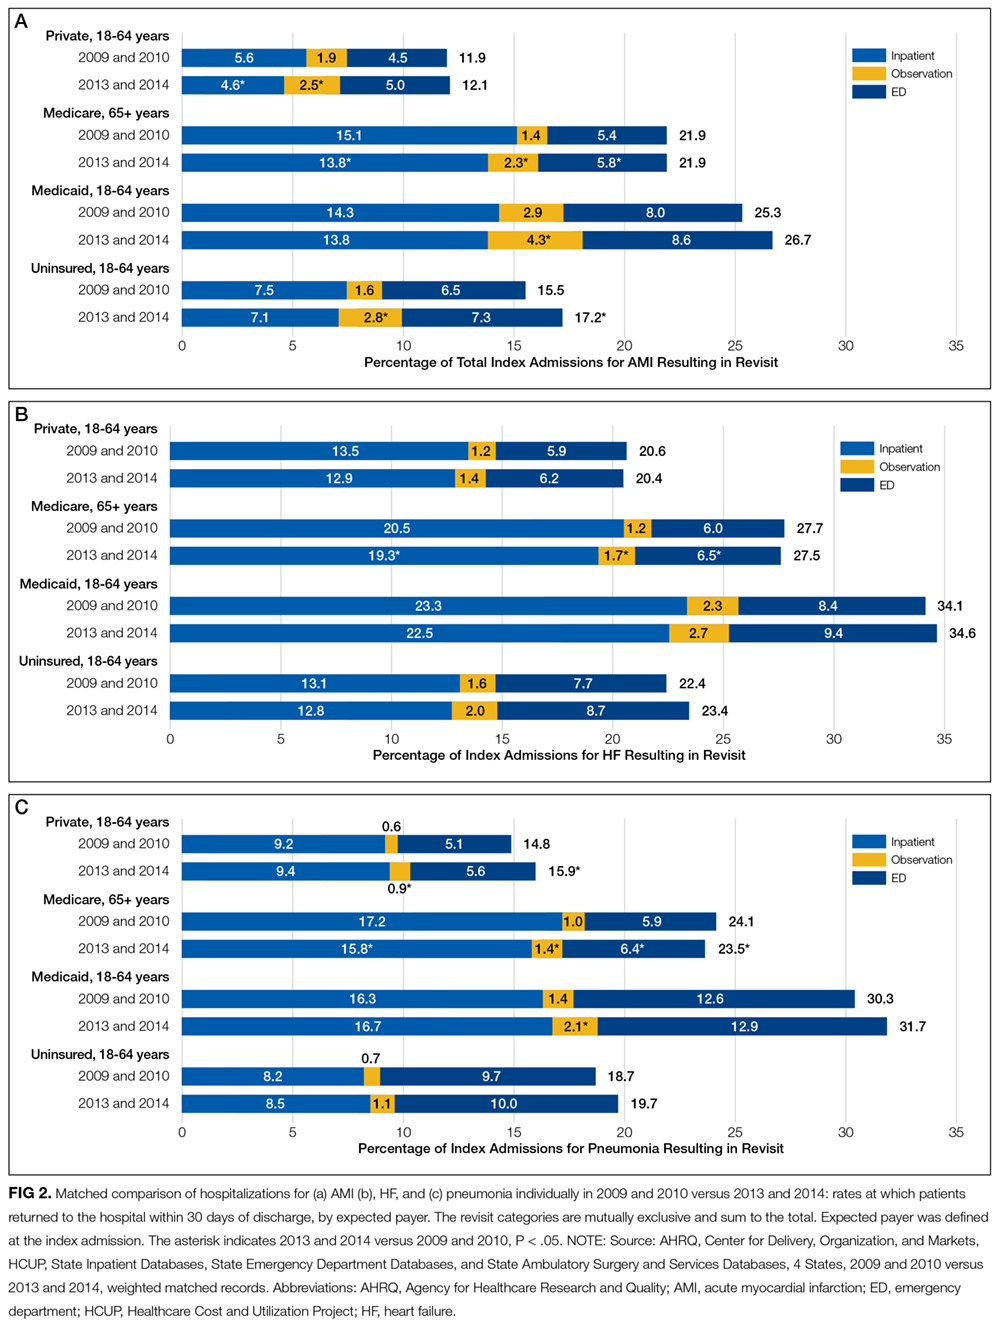
Patients initially hospitalized for HF and pneumonia who returned to the hospital within 30 days often returned for the same conditions (Table 2).