If You Book It, Will They Come? Attendance at Postdischarge Follow-Up Visits Scheduled by Inpatient Providers


BACKGROUND: Postdischarge follow-up visits (PDFVs) are widely recommended to improve inpatient-outpatient transitions of care.
OBJECTIVE: To measure PDFV attendance rates. DESIGN: Observational cohort study.
SETTING: Medical units at an academic quaternary-care hospital and its affiliated outpatient clinics.
PATIENTS: Adult patients hospitalized between April 2014 and March 2015 for whom at least 1 PDFV with our health system was scheduled. Exclusion criteria included nonprovider visits, visits cancelled before discharge, nonaccepted health insurance, and visits scheduled for deceased patients.
MEASUREMENTS: The study outcome was the incidence of PDFVs resulting in no-shows or same-day cancellations (NS/SDCs).
RESULTS: Of all hospitalizations, 6136 (52%) with 9258 PDFVs were analyzed. Twenty-five percent of PDFVs were NS/SDCs, 23% were cancelled before the visit, and 52% were attended as scheduled. In multivariable regression models, NS/SDC risk factors included black race (odds ratio [OR] 1.94, 95% confidence interval [CI], 1.63-2.32), longer lengths of stay (hospitalizations ≥15 days: OR 1.51, 95% CI, 1.22-1.88), and discharge to facility (OR 2.10, 95% CI, 1.70-2.60). Conversely, NS/SDC visits were less likely with advancing age (age ≥65 years: OR 0.39, 95% CI, 0.31-0.49) and driving distance (highest quartile: OR 0.65, 95% CI, 0.52-0.81). Primary care visits had higher NS/SDC rates (OR 2.62, 95% CI, 2.03-3.38) than oncologic visits. The time interval between discharge and PDFV was not associated with NS/SDC rates.
CONCLUSIONS: PDFVs were scheduled for more than half of hospitalizations, but 25% resulted in NS/SDCs. New strategies are needed to improve PDFV attendance. Journal of Hospital Medicine 2017;12:618-625. © 2017 Society of Hospital Medicine
Study Outcomes
The primary study outcome was PDFV attendance. Each PDFV’s status was categorized by outpatient clinic staff as attended, cancelled, or NS. For cancelled appointments, cancellation dates and reasons (if entered by clinic representatives) were collected. In keeping with prior studies investigating outpatient nonattendance,we calculated collective NS/SDC rates for the variables listed above.17,22-25 We additionally calculated NS/SDC and attendance-as-scheduled rates stratified by the number of PDFVs per patient to assess for a “high-utilizer” effect with regard to PDFV attendance.
Statistical Analysis
We used multivariable mixed-effects regression with a logit link to assess associations between age, gender, race, insurance, driving distance quartile, length of stay, discharging service, postdischarge disposition, the number of PDFVs per hospitalization, PDFV specialty type, PDFV season, PDFV lead time, and our NS/SDC outcome. The mixed-effects approach was used to account for correlation structures induced by patients who had multiple visits and for patients with multiple hospitalizations. Specifically, our model specified 2 levels of nesting (PDFVs nested within each hospitalization, which were nested within each patient) to obtain appropriate standard error estimates for our adjusted odds ratios (ORs). Correlation matrices and multivariable variance inflation factors were used to assess collinearity among the predictor variables. These assessments did not indicate strong collinearity; hence, all predictors were included in the model. Only driving distance had a small amount of missing data (0.18% of driving distances were unavailable), so multiple imputation was not undertaken. Analyses were performed using R version 3.3.1 (R Foundation for Statistical Computing, Vienna, Austria).
RESULTS
Baseline Characteristics
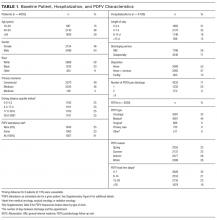

During the 1-year study period, there were 11,829 discrete hospitalizations in medical units at our hospital. Of these hospitalizations, 6136 (52%) had at least 1 UPHS-affiliated PDFV meeting our inclusion and exclusion criteria, as detailed in the Figure. Across these hospitalizations, 9258 PDFVs were scheduled on behalf of 4653 patients. Demographic characteristics for these patients, hospitalizations, and visits are detailed in Table 1. The median age of patients in our cohort was 61 years old (interquartile range [IQR] 49-70, range 18-101). The median driving distance was 17 miles (IQR 4.3-38.8, range 0-2891). For hospitalizations, the median length of stay was 5 days (IQR 3-10, range 0-97). The median PDFV lead time, which is defined as the number of days between discharge and PDFV, was 12 days (IQR 6-23, range 1-60). Overall, 41% of patients (n = 1927) attended all of their PDFVs as scheduled; Supplementary Figure 1 lists patient-level PDFV attendance-as-scheduled percentages in more detail.
Incidence of NSs and SDCs
Twenty-five percent of PDFVs (n = 2303) were ultimately NS/SDCs; this included 1658 NSs (18% of all appointments) and 645 SDCs (7% of all appointments). Fifty-two percent of PDFVs (n = 4847) were kept as scheduled, while 23% (n = 2108) were cancelled before the day of the visit. Of the 2558 cancellations with valid cancellation dates, 49% (n = 1252) were cancelled 2 or fewer days beforehand, as shown in Supplementary Figure 2.
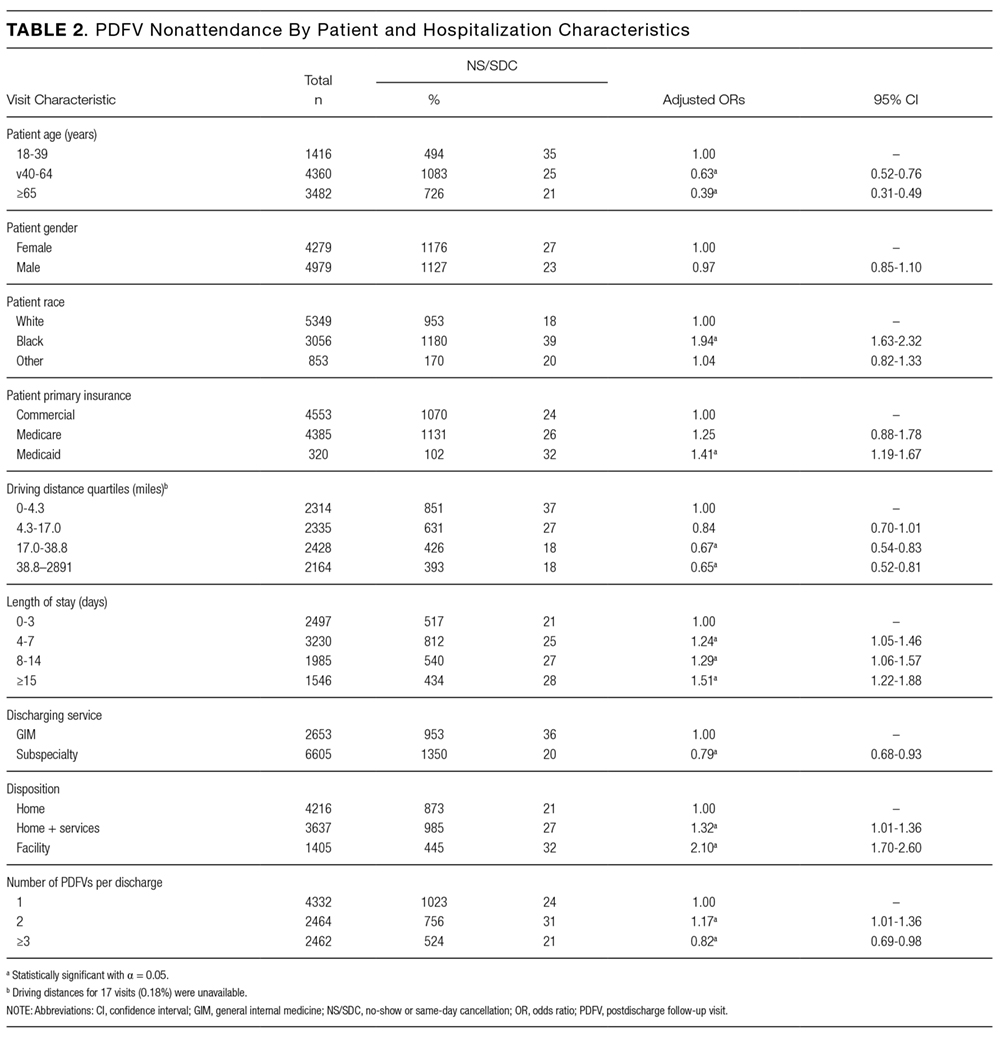
The presence of exactly 2 PDFVs per hospitalization was also associated with higher NS/SDC rates (OR 1.17, 95% CI, 1.01-1.36), compared to a single PDFV per hospitalization; however, the presence of more than 2 PDFVs per hospitalization was associated with lower NS/SDC rates (OR 0.82, 95% CI, 0.69-0.98). A separate analysis (data not shown) of potential high utilizers revealed a 15% NS/SDC rate for the top 0.5% of patients (median: 18 PDFVs each) and an 18% NS/SDC rate for the top 1% of patients (median: 14 PDFVs each) with regard to the numbers of PDFVs scheduled, compared to the 25% overall NS/SDC rate for all patients.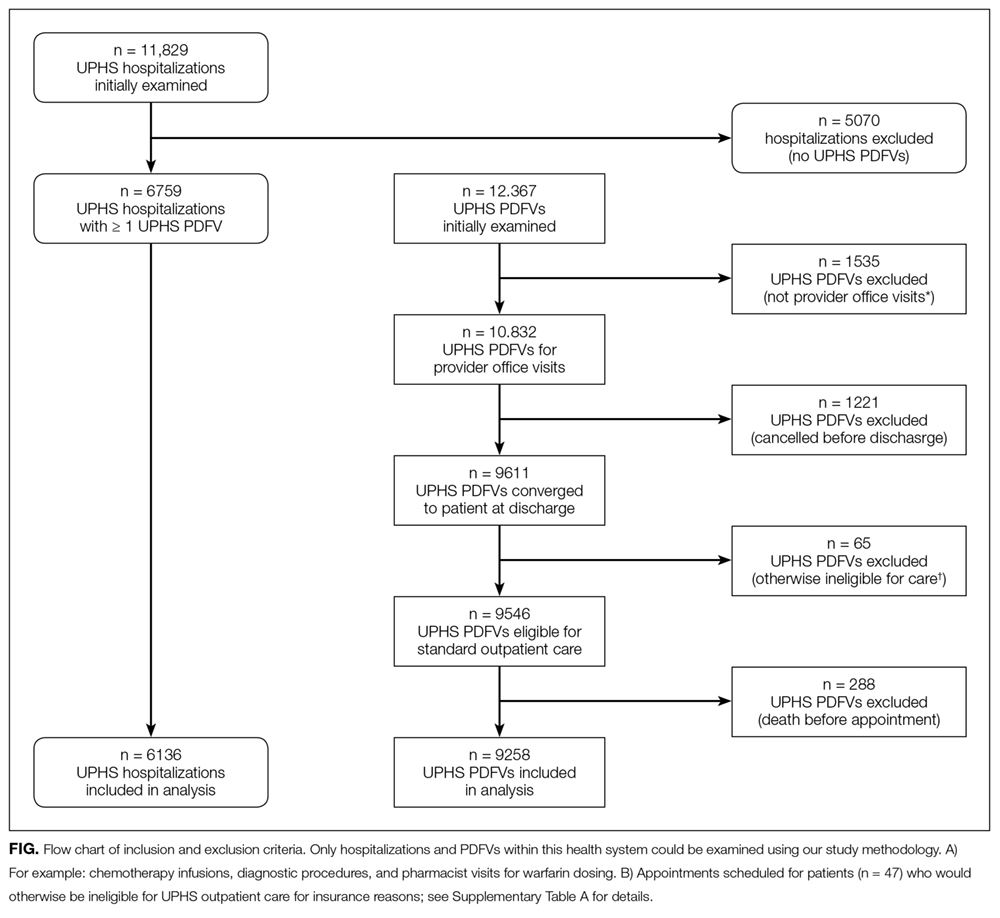
NS/SDC rates and adjusted ORs with regard to individual PDFV characteristics are displayed in Table 3. Nononcologic visits had higher NS/SDC rates than oncologic visits; for example, the NS/SDC rate for primary care visits was 39% (OR 2.62, 95% CI, 2.03-3.38), compared to 12% for oncologic visits. Appointments in the “other” specialty category also had high nonattendance rates, as further described in Supplementary Table B. Summertime appointments were more likely to be attended (OR 0.81, 95% CI, 0.68-0.97) compared to those in the spring. PDFV lead time (the time interval between the discharge date and appointment date) was not associated with changes in visit attendance.
