Excess Readmission vs Excess Penalties: Maximum Readmission Penalties as a Function of Socioeconomics and Geography


BACKGROUND: The Hospital Readmission Reduction Program (HRRP) penalizes hospitals with “excess” readmissions up to 3% of Medicare reimbursement. Approximately 75% of eligible hospitals received penalties, worth an estimated $428 million, in fiscal year 2015.
OBJECTIVE: To identify demographic and socioeconomic disparities between matched and localized maximum-penalty and no-penalty hospitals.
DESIGN: A case-control study in which cases included were hospitals to receive the maximum 3% penalty under the HRRP during the 2015 fiscal year. Controls were drawn from no-penalty hospitals and matched to cases by hospital characteristics (primary analysis) or geographic proximity (secondary analysis).
SETTING: A selectiion of 3383 US hospitals eligible for HRRP. PARTICIPANTS: Thirty-nine case and 39 control hospitals from the HRRP cohort.
MEASUREMENTS: Socioeconomic status variables were collected by the American Community Survey. Hospital and health system characteristics were drawn from Centers for Medicare and Medicaid Services, American Hospital Association, and Dartmouth Atlas of Health Care. The statistical analysis was conducted using Student t tests.
RESULTS: Thirty-nine hospitals received a maximum penalty. Relative to controls, maximum-penalty hospitals in counties with lower SES profiles are defined by increased poverty rates (19.1% vs 15.5%, P = 0.015) and lower rates of high school graduation (82.2% vs 87.5%, P = 0.001). County level age, sex, and ethnicity distributions were similar between cohorts.
CONCLUSION: Cases were more likely than controls to be in counties with low socioeconomic status; highlighting potential unintended consequences of national benchmarks for phenomena underpinned by environmental factors; specifically, whether maximum penalties under the HRRP are a consequence of underperforming hospitals or a manifestation of underserved communities. Journal of Hospital Medicine 2017;12:610-617. © 2017 Society of Hospital Medicine
Case-Control Matching
In the primary analysis, coarsened exact matching (CEM) matched controls to cases by potential confounding hospital characteristics, including the following: ownership, number of beds, case mix index (measure of acuity), ambulatory care visit rates within 14 days of discharge, and total number of penalty-eligible cases, including HF, AMI, COPD, PN, and THA/TKA.
In the secondary analysis, hospitals were geocoded by zip code. Geographic Information Systems mapping software (ESRI ArcGIS, Redlands, CA) relied upon Euclidean allocation distance spatial analysis17,18 to match each maximum-penalty hospital to the nearest nonpenalty hospital. Each case was matched to a distinct control; duplicate controls were replaced with the nearest unmatched no-penalty hospital.
Statistical Analysis
Univariate analyses utilized unpaired Student t tests (primary analysis) and paired Student t tests (secondary analysis). The CEM algorithm matches by strata rather than pairs, precluding paired Student t tests in the primary analysis. Statistical analyses were conducted using STATA (StataCorp. 2013. Stata Statistical Software: Release 13. College Station, TX).
RESULTS
Maximum Penalty and Nonpenalty Hospital Matching
Of 3383 hospitals eligible for the HRRP, 39 received the maximum penalty and 770 received no penalty. Thirty-eight control hospitals were identified using CEM algorithm; 1 maximum-penalty hospital could not be matched and was excluded from primary analy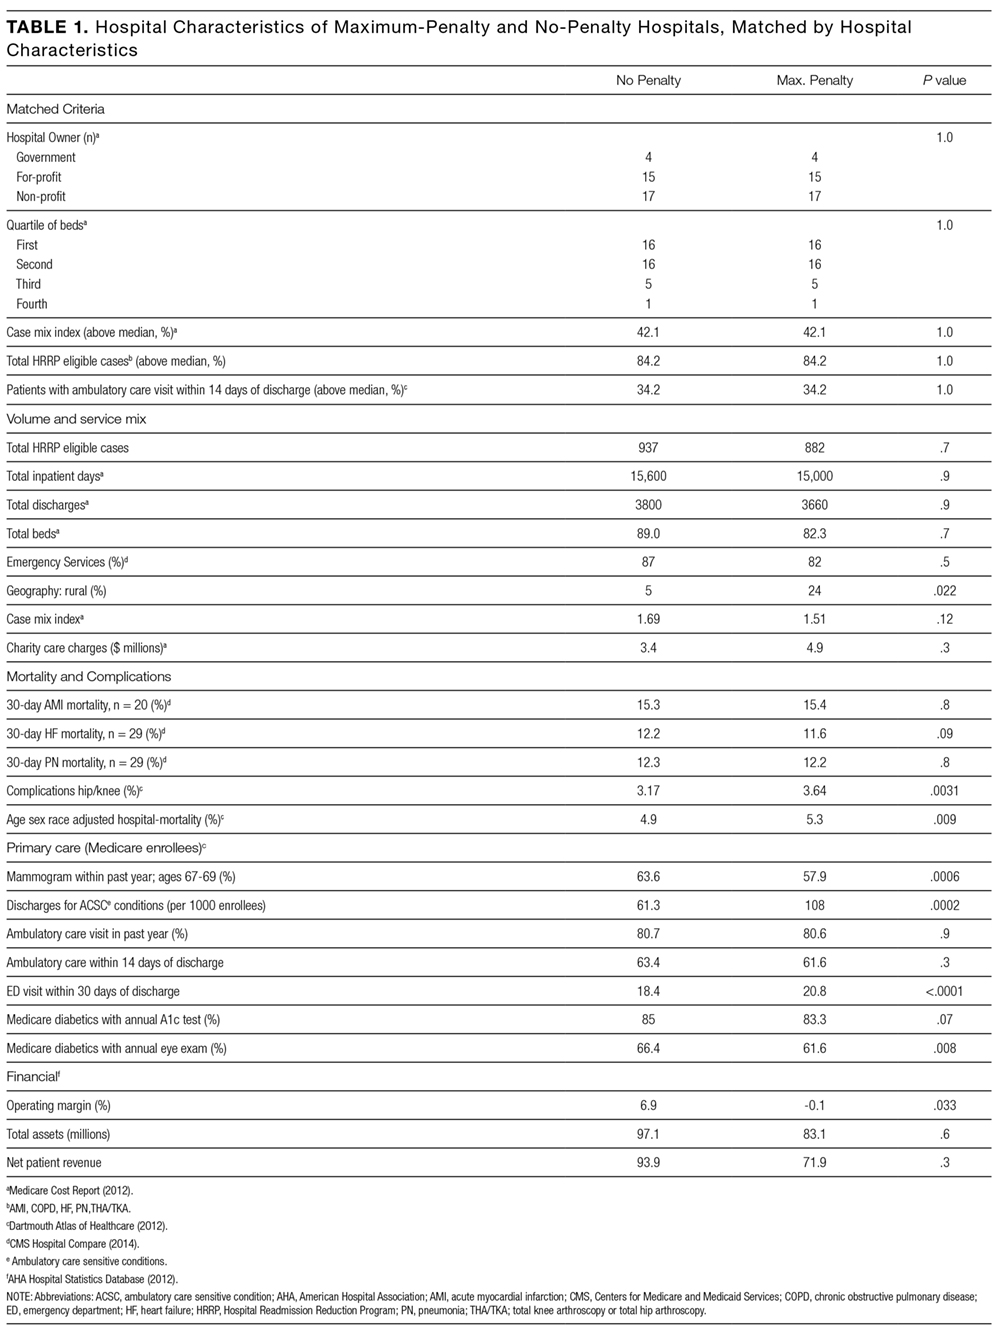
Hospital Characteristics
Case and control profiles are presented in Table 1. Cases and controls were matched by characteristics which may impact readmission rates (Table 1). CEM yielded cohorts similar across a spectrum of metrics, and identical in terms of matching criteria including ownership, beds (quartile), case mix index (above median), ambulatory care visit within 14 days of discharge (above median), and total number of penalty-eligible cases (above median). Relative to no-penalty hospitals, maximum-penalty hospitals were more likely rural (n = 9 vs n = 2, P = 0.022) and have a less profitable operating margin (0.1% vs 6.9%), and location within HSAs with higher age, sex, and race adjusted hospital-wide mortality rate (5.3% vs 4.9%, P = 0.009) and higher rates of discharge for ambulatory care sensitive conditions (108 vs 63 discharges per 1000 Medicare enrollees).
Demographic and Socioeconomic Characteristics
As presented in Table 2, cases a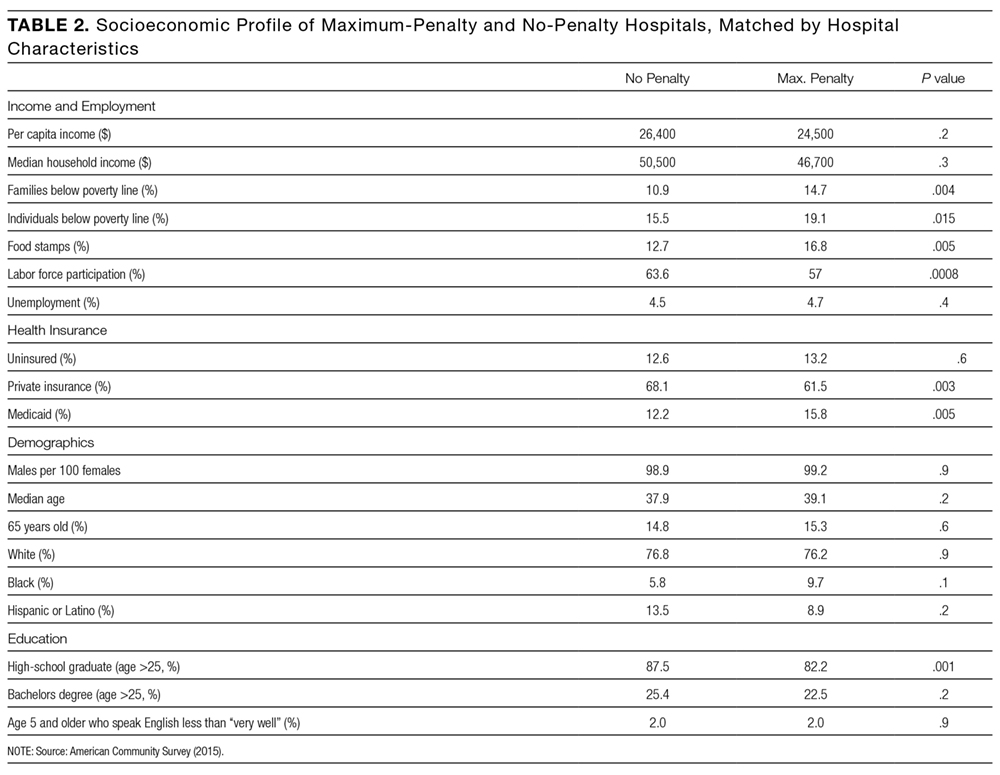
Secondary Analysis: Geographical Matching
Secondary analysis matched each maximum-penalty hospital to the nearest no-penalty hospital using a global information system vector analysis algorithm. As shown in the Figure, median distance between the case and the control was 42.5 miles (interquartile range: 25th percentile, 15.4 miles; 75th percentile, 98.4 miles). Seventeen pairs (44%) were in the same HRR, 6 of which were in the same HSA. Seven pairs (18%) were within the same county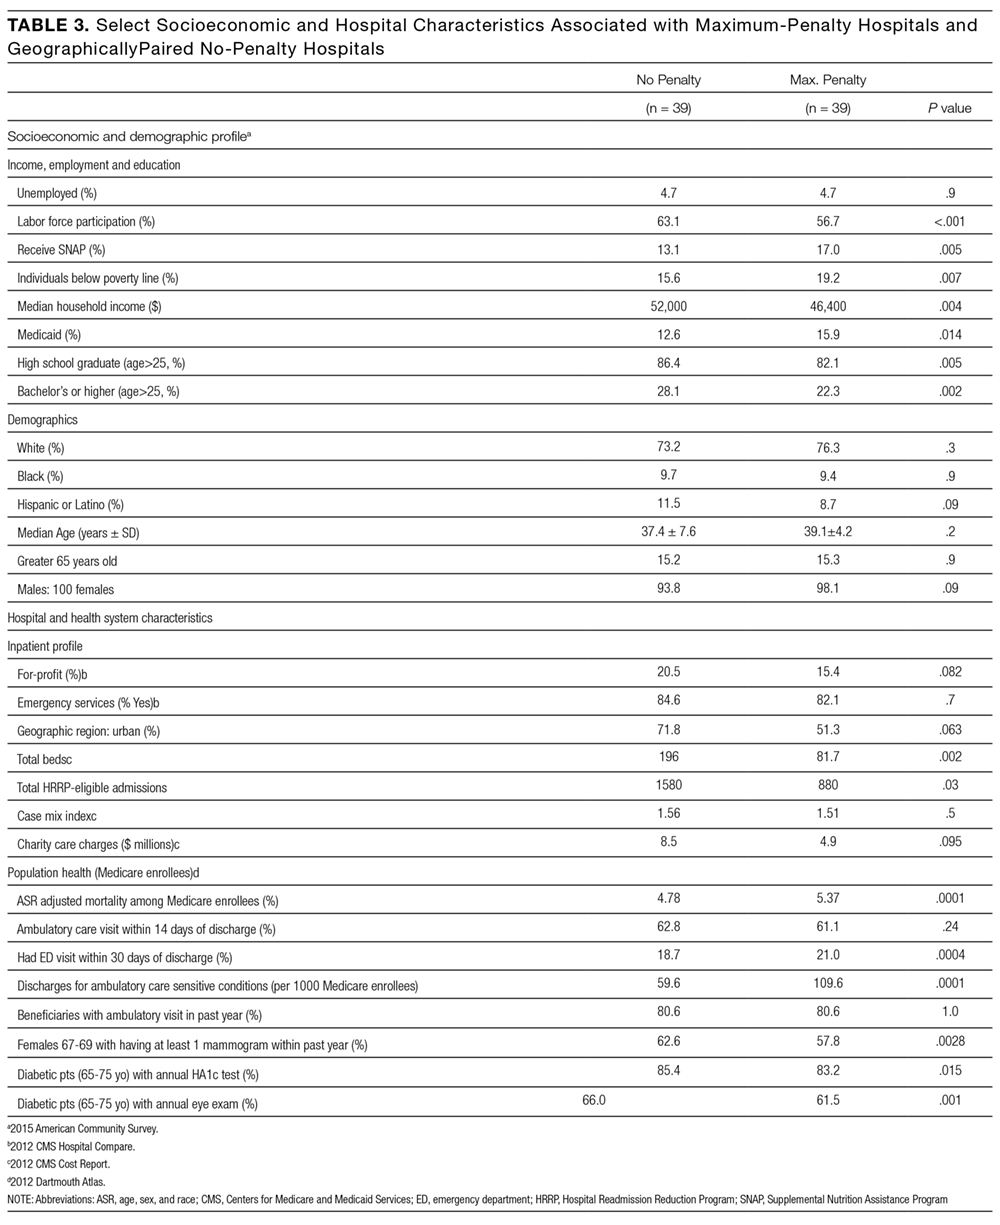
Secondary Analysis: Economic and Demographic Profiles of Geographically Matched Pairs
Demographic and socioeconomic profiles are presented in Table 3. The cases and controls are in counties with similar age, sex, and ethnicity distributions. Relative to no-penalty hospitals, maximum-penalty hospitals are in counties with lower socioeconomic profiles, including increased rates of poverty (15.6% vs 19.2%, P = 0.007) and lower rates of high school (86.4% vs 82.1%, P = 0.005) or college graduation (22.3% vs 28.1%, P = 0.002). Seven pairs were in the same county; a sensitivity analysis excluding these hospitals revealed similarly lower SES profile in cases relative to controls (Supplementary Table 1).
DISCUSSION
Our analysis reveals that county-level socioeconomic profiles are predictors of maximum HRRP penalties. Specifically, after matching cases and controls on 5 hospital characteristics that may influence readmission, maximum-penalty hospitals were more likely to be in rural counties with higher rates of poverty and lower rates of education relative to no-penalty hospitals. We observed no difference between cases and controls with respect to age, sex, or ethnicity.
Our study complement
