Association between radiologic incidental findings and resource utilization in patients admitted with chest pain in an urban medical center


BACKGROUND
Increasing use of testing among hospitalized patients has resulted in an increase in radiologic incidental findings (IFs), which challenge the provision of high-value care in the hospital setting.
OBJECTIVE
To understand impact of radiologic incidental findings on resource utilization in patients hospitalized with chest pain.
DESIGN
Retrospective observational cross sectional study.
SETTING
Academic medical center.
PARTICIPANTS
Adult patients hospitalized with principal diagnosis of chest pain.
MEASUREMENTS
Demographic, imaging, and length of stay (LOS) data were abstracted from the medical charts. We used multiple logistic regression to evaluate factors associated with radiologic IFs and negative binomial regression to evaluate the association between radiologic IFs and LOS.
RESULTS
1811 consecutive admissions with chest pain were analyzed retrospectively over a period of 24 months; 376 patients were included in the study after exclusion criteria were applied and readmissions removed. Of these, 197 patients (52%) had 364 new radiologic IFs on imaging; most IFs were of minor (50%) or moderate clinical significance (42%), with only 7% of major significance. Odds of finding radiologic IFs increased with age (adjusted odds ratio, 1.04; 95% confidence interval [CI], 1.01-1.06) and was associated with a 26% increase in LOS (adjusted incidence rate ratio, 1.26; 95% CI, 1.07-1.49).
CONCLUSION
Radiologic IFs were very common among patients hospitalized with chest pain of suspected cardiac origin and independently associated with an increase in the LOS. Interventions to address radiologic IFs may reduce LOS and, thereby, support high-value care. Journal of Hospital Medicine 2017;12:323-328. © 2017 Society of Hospital Medicine
© 2017 Society of Hospital Medicine
Measurements
Data collection was completed retrospectively by medical record review using a standardized CPaC Study protocol. The database was created and maintained using REDCap (Research Electronic Data Capture; Vanderbilt University, Knoxville, Tennessee) electronic data capture tool hosted at Johns Hopkins University.13 All data were manually abstracted into REDCap from electronic medical records. All missing values and inconsistent data were reviewed by multiple physicians to ensure data integrity.
We defined all diagnostic (noninterventional; nonlaboratory) testing done during a patient’s hospitalization as “diagnostic” tests, except cardiac stress testing and echocardiogram. We defined diagnostic tests as “primary” tests if they were done in response to patients’ presenting complaint. We defined diagnostic tests as “secondary” tests if they were done by providers due to IFs. Cardiac computed tomography was included in diagnostic tests. Cardiac testing (echocardiogram, cardiac stress testing, cardiac catheterization and pacemaker placement) was considered separate from the “diagnostic tests” since these were focused cardiac imaging that are interventional in nature with low yield on extra-cardiac radiologic IFs.
Incidental findings were defined as any unexpected findings on diagnostic imaging unrelated to the reason for admission, and were classified based on organ systems and their clinical significance as major, moderate, or minor using a classification previously published by Lumbreras et al.14 All radiologic IFs data underwent sequential dual review by investigators for accuracy of documentation. Individuals with multiple radiologic IFs belonging to more than one category of clinical significance were categorized with the IFs group of highest clinical significance. Ten percent of the patients with no IFs were reviewed again, and no errors found.
Demographic variables at the time of admission included age, sex, race, level of education, employment status, insurance status, body mass index (BMI), and smoking status. Comorbid conditions at the time of admission consisted of the following: hypertension, diabetes mellitus, chronic kidney disease (CKD), chronic obstructive pulmonary disease (COPD), history of myocardial infarction, cerebrovascular accident (CVA), congestive heart failure (CHF), drug use and malignancy or history of it. Initial laboratory values were extracted from electronic medical records and included hemoglobin, creatinine, blood urea nitrogen (BUN), aspartate transaminase, alanine transaminase, and alkaline phosphatase. We calculated the estimated glomerular filtration rate (eGFR) using the MDRD (Modification of Diet in Renal Disease) equation.15 Admission and discharge information as well as whether the patient had a primary care provider, were obtained from medical records. The length of hospital stay was calculated by subtracting date of admission from date of discharge.
Statistical Analysis
We conducted 2 main analyses: 1) a descriptive analysis of the association between patient characteristics (independent variables) and identification of IFs during admission (primary outcome) and 2) an analysis of the association between identification of incidental findings during admission (independent variable) and LOS (primary outcome).
For the descriptive analysis of radiologic IFs, we compared the characteristics of patients with and without radiologic IFs during admission using a t-test (for normally distributed continuous variables) or Mann-Whitney test (for nonnormally distributed continuous variables) and a chi-square or Fisher exact test for categorical variables based on the number of observations. We included variables significantly associated with the occurrence of radiologic IFs (P < 0.05) in a multiple logistic regression model to identify characteristics independently associated with presence of radiologic IFs.
Length of stay was right-skewed even after natural logarithm transformation and, therefore, we used negative binomial regression for the analysis of the association between the identification of radiologic IFs during admission and LOS. We included potential confounding variables in the multiple negative binomial regression model based on plausibility of confounding and association with both the exposure (identification of radiologic IFs during admission) and outcome (LOS) at a level of P < 0.3. Age, education level, history of drug use, history of CHF, history of CKD, lower eGFR, higher serum creatinine/BUN, hemoglobin, occurrence of cardiac catheterization, stress testing, and multiple admissions during the study period were identified as confounders. For correlated variables (eg, hemoglobin and hematocrit), the variable with the strongest statistical association (lowest P value) was included in the model. In sensitivity analysis, we dropped patients with extreme LOS (longer than 10 days). All analyses were performed using STATA 13 (Stata Statistical Software: Release 13; StataCorp., College Station, Texas).
RESULTS
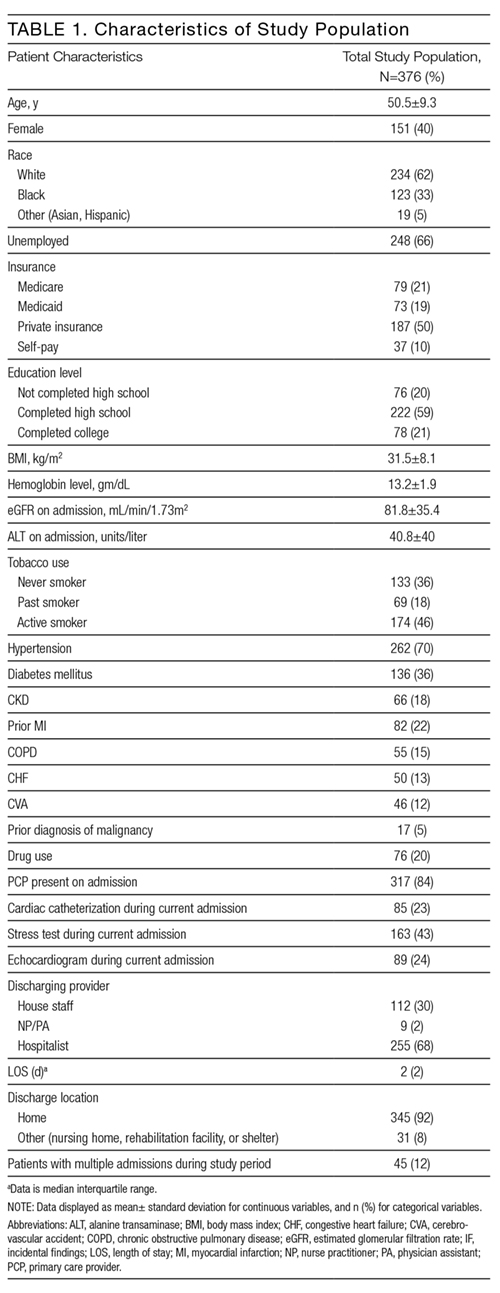
Table 1 shows the characteristics of the 376 patients included in this study. Overall mean age was 50.5 years, 40% were females, 62% were Caucasian, 66% were unemployed, 84% identified a primary care provider upon admission, and 68% were cared for by a hospitalist. Overall median LOS was 2 days (interquartile range [IQR] = 2). Of the 376 patients in the study, 197 (52%) had new radiologic IFs. Comparing the patients with radiologic IFs and no IFs, it was evident that more radiological tests were performed in the IF group (2.2 tests per patient) in comparison with the no IF group (1.26 tests per patient). Looking at patient characteristics, patients with radiologic IFs were older (52 years vs. 48.8 years; P < 0.001), reported a lower education level and lower hemoglobin levels on admission (12.0 gm/dL vs. 13.4 gm/dL; P = 0.029), but were more likely to be unemployed (72% vs. 59%; P = 0.009), have COPD (19% vs. 10%; P = 0.007), and a history of malignancy (7% vs. 2%, P = 0.04). In addition, patients in the radiologic IF group had lower rates of cardiac catheterization (18% vs. 28%; P = 0.02), were more likely to be readmitted more than once during the study period (17% vs. 7%; P = 0.02) and be discharged by hospitalists (75% vs. 60%; P = 0.003; Supplemental Table 1).
