Impact of a Community Health Worker–Led Diabetes Education Program on Hospital and Emergency Department Utilization and Costs


To account for DEP participants without encounter data, we estimated average cost savings in a 4-step process using a propensity score adjustment approach. We stratified encounters based on admission type (inpatient vs. ED) and combined the average cost savings calculated for both admission types to calculate mean total medical cost savings.
In the first step, direct cost was modeled on DEP participants with an encounter to obtain parameter estimates for pre- and post- program enrollment, age, sex, and ethnicity. The model was based on the log-link function with the gamma distribution. In the second step, we ran a propensity score logistic regression model to estimate the probability of any encounter being identified in the DFWHC database, adjusted for age, sex, ethnicity, and DEP clinic. In the third step, we generated 10,000 bootstrap samples, with replacement, to estimate the DEP population’s median expected change in cost. In the bootstrap sample, the parameter estimates from step 1 were used to predict the cost pre- and post- program enrollment for each patient. The expected change in cost per participant was then calculated, while adjusting for the propensity to have an encounter, estimated in step 2. The formula for calculating change in cost was Expected change in cost = [pre probability*pre cost – post probability*post cost].
In the final step, we retained the median cost savings from each bootstrap sample. Inpatient and ED cost savings were combined to produce a total cost savings across the patient population. The ROI formula was Financial gain (utilization cost savings – DEP investment)/DEP investment.
Results
Participant Demographics
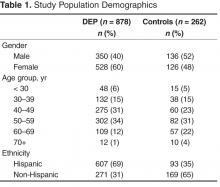
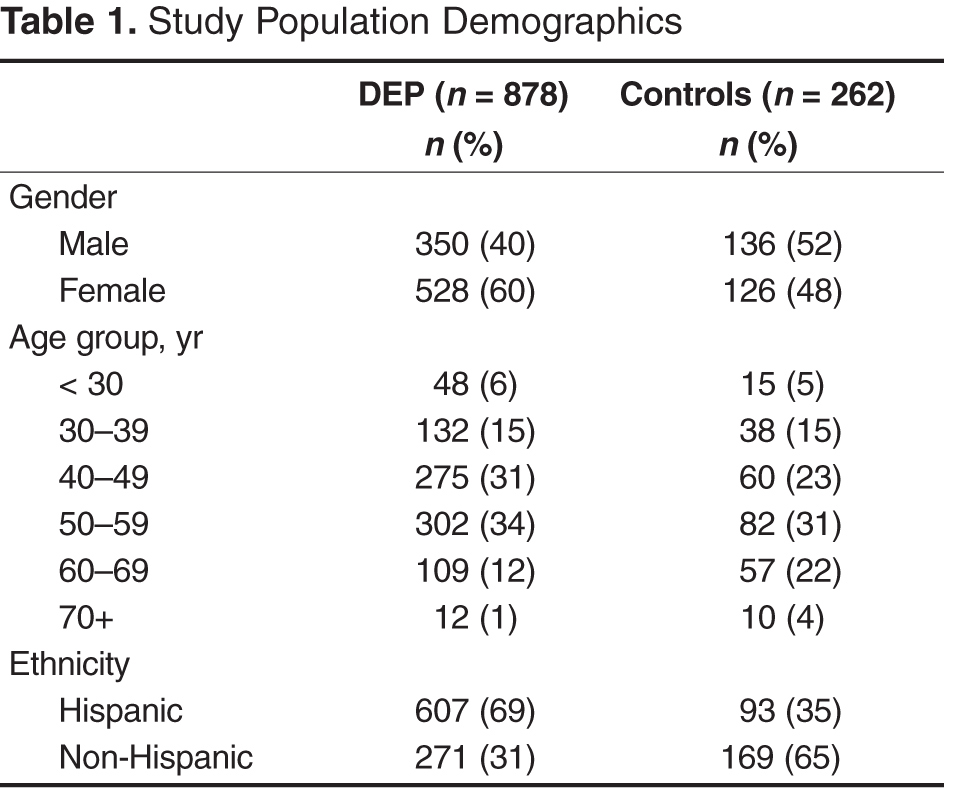
Of the 1140 study participants, 878 were DEP patients and 262 were controls (Table 1). The majority of DEP patients were Hispanic females older than 40 years while the majority of the the control group was non-Hispanic males older than 40. Table 2 and Table 3 display the top 5 primary ICD-9 diagnoses by intervention group and pre/post enrollment status. Type 2 diabetes was the top diagnosis among DEP participants and controls with a pre-enrollment encounter. 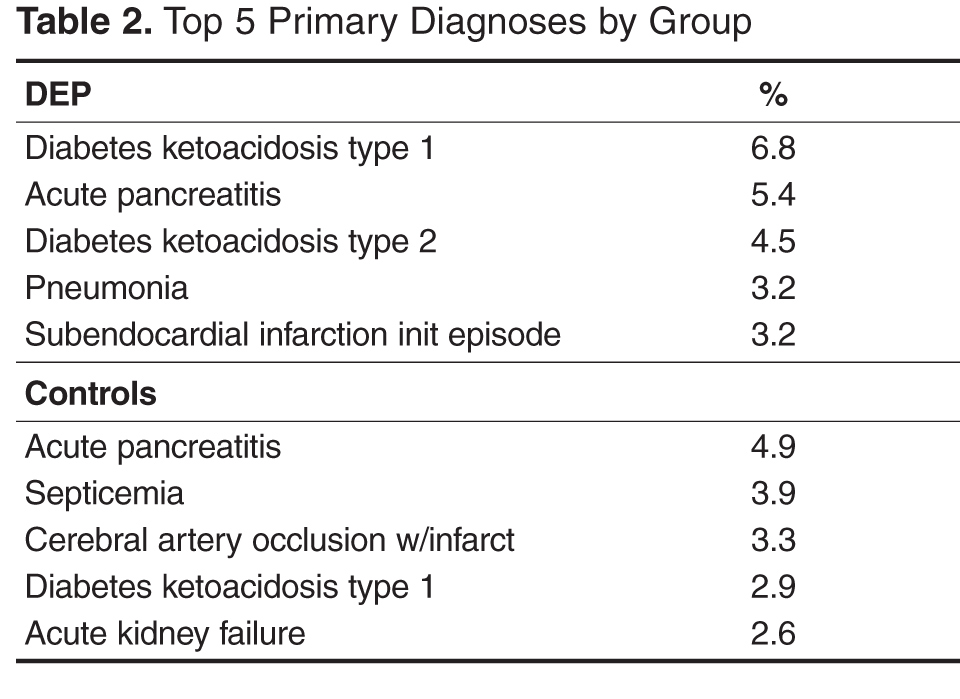
Inpatient Encounters
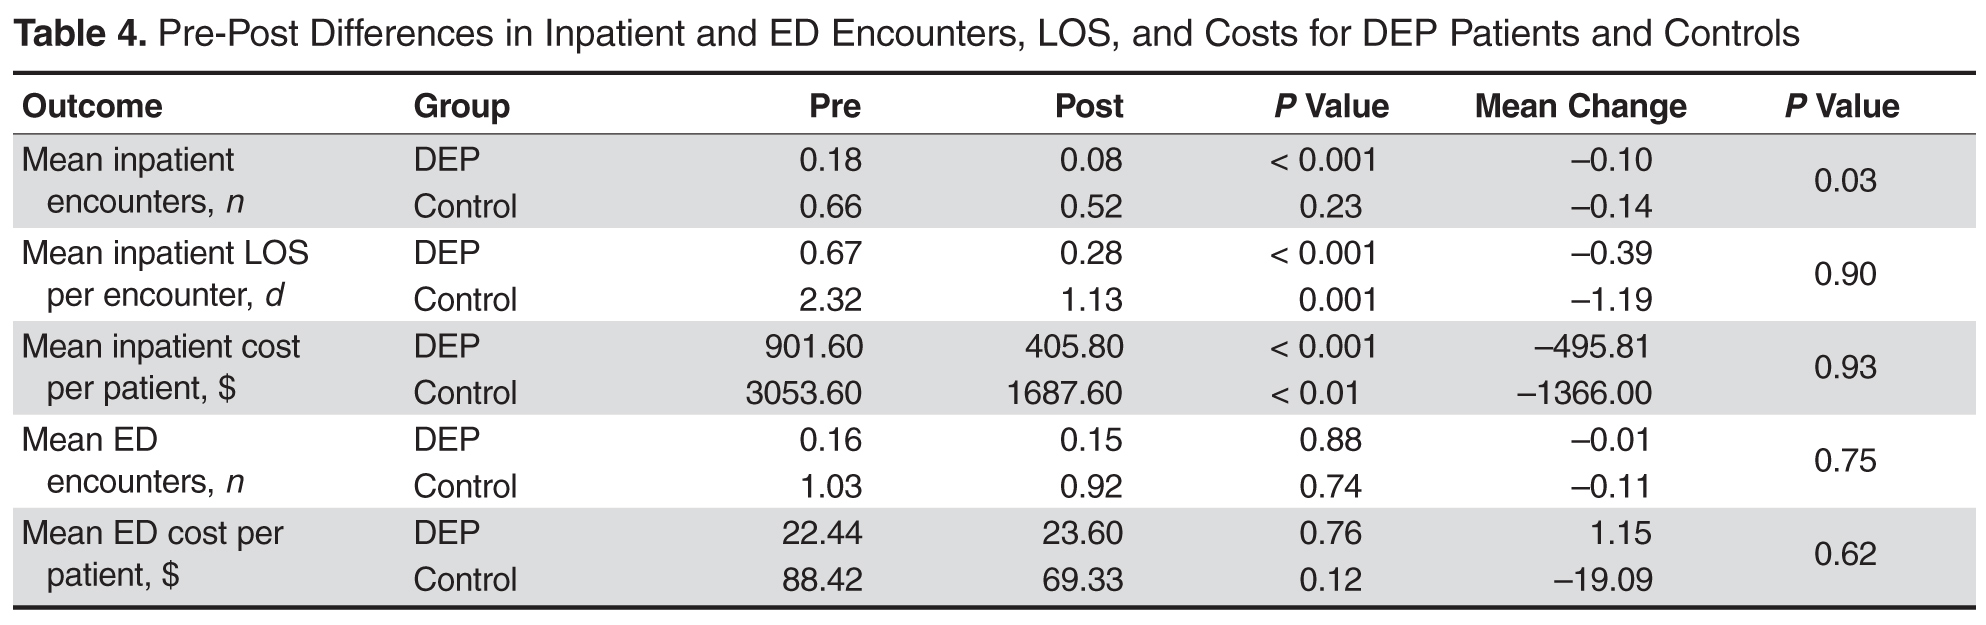
Fourteen percent of the DEP participants and 37% of control group patients matched to an inpatient record during the pre-enrollment time period. The number of mean inpatient encounters for DEP participants decreased from 0.18 to 0.08 (P < 0.001) in the post period 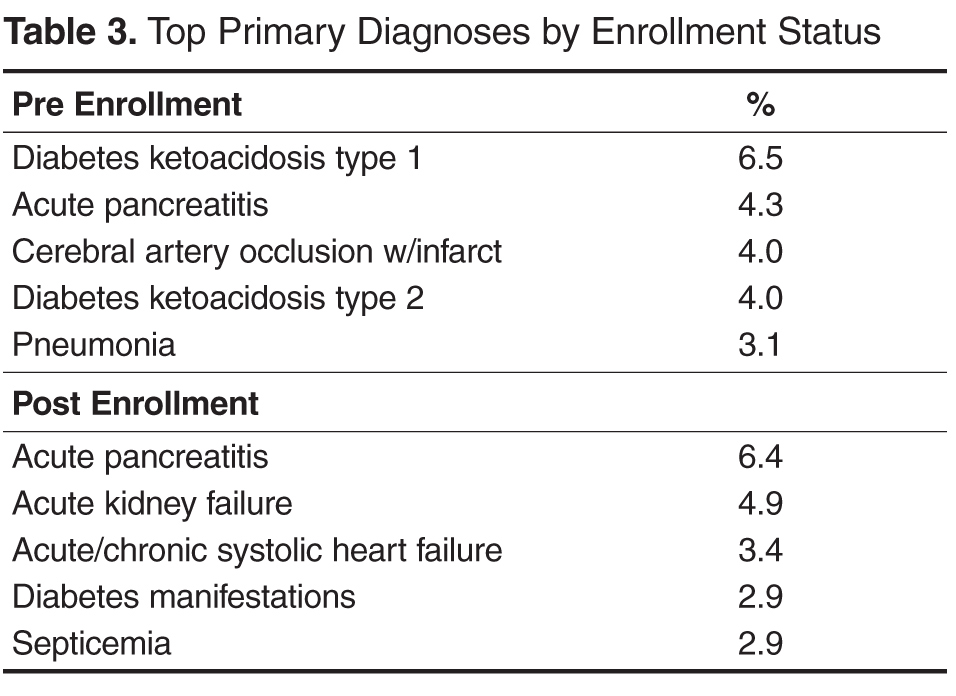
Emergency Department Encounters
Eight percent of the DEP participants and 30% of controls matched to an ED record for the year prior to program enrollment. Neither DEP patients nor patients in the control group had a significant reduction in mean ED encounters (P = 0.88 and 0.74, respectively) or costs (P = 0.76 and 0.12, respectively) post enrollment.
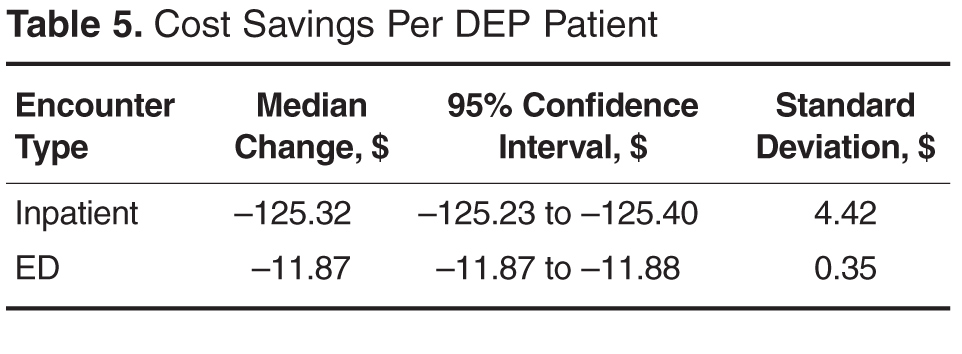
The cost savings per DEP patient are shown in Table 5. The annual cost for a CHW to educate 1 DEP patient was $403. The combined inpatient and ED cost savings for DEP patients post-program enrollment was $137 per patient. ROI for the DEP was –66%, indicating that DEP investment costs were greater than the savings achieved through the reduction of inpatient and ED costs for DEP patients.
Discussion
In our examination of the impact of the DEP on inpatient and ED utilization, we found that DEP patients experienced a significant decrease in inpatient visits, LOS, and direct costs in the year following DEP enrollment. In comparison, a control group of patients who were treated at the same clinics as DEP patients also experienced significant decreases in inpatient LOS and direct costs. No significant differences in ED visits, LOS, or direct costs were observed for either DEP patients or control patients in the post period.
The reduction in inpatient visits and LOS for DEP patients in the year following DEP enrollment indicates that the DEP helped patients achieve improved health and avoid costly hospitalizations. The control group did experience greater reductions in inpatient utilization, LOS, and direct costs. However, because this was not designed as a controlled trial, we utilized a nonequivalent control group and inherent differences between the DEP and control patients and utilization patterns made it difficult to draw unbiased comparisons between the groups. For instance, the number of inpatient encounters, LOS, and costs were 2 to 3 times higher in the pre-period for the control group. The mean number of inpatient encounters for DEP patients prior to DEP participation was 0.18, and the smaller change observed in utilization for DEP patients is likely due to a floor effect.
Despite the observed reductions for both DEP patients and the control group in inpatient utilization, neither group had significant reductions in ED visits or costs per patient in the post- period. The majority of ED use in the pre-period may have been due to diabetes-related complications that are difficult to prevent even with improved diabetes care or for emergencies not related to diabetes, as we included all ED admissions regardless of admitting diagnosis. In addition, similar to observed trends in inpatient utilization, ED use in the pre-period was relatively low for DEP patients (0.16), and the lack of observed changes in ED utilization for DEP patients was also likely due to a floor effect.
The DEP generated a negative ROI (–66%) in the short term as the annual cost savings generated per patient from reduced utilization ($137) were less than the annual DEP costs (investment) per patient ($403). This finding is not surprising, as it is difficult to achieve cost savings for interventions designed to increase access to health care in underserved populations.[15] Although Fedder et al. observed an average savings of $2245 per patient per year in Medicaid reimbursements for a CHW-led outreach program for patients on Medicaid with diabetes, patients who participated in this program had much higher inpatient encounters (0.95 vs. 0.18) and ED utilization (1.49 vs. 0.16) at baseline compared to DEP patients. DEP patients may not have been as sick as these patients or have been more reluctant to seek medical care due to their lack of insurance. In addition, Fedder et al did not factor in the costs of the CHW program in the cost savings calculation. However, these costs were likely to be much lower than the costs of the DEP, as the program relied on volunteer CHWs instead of paid CHWs who were also certified medical assistants.
Several studies have evaluated the cost-effectiveness of CHW-led diabetes management programs rather than the ROI as these types of programs are often associated with improved health outcomes but also increased health care costs as the result of expanding health care access and services to underserved populations [15,25–29]. Most of these evaluations modeled the long-term cost-effectiveness, as the majority of cost savings from diabetes management programs are likely to accrue in the long run as a result of the prevention of diabetes-related complications such as amputations, blindness, kidney failure, coronary heart disease, and stroke [15,25]. Although these CHW-led interventions for diabetes differed in scope, the incremental cost effectiveness ratios for these interventions were less than the common willingness-to-pay threshold of $50,000 per quality-adjusted life year (QALY). These studies may have underestimated the societal benefits of these programs as they did not incorporate non-medical cost savings such as those that may be attributed to gains in productivity [26].