Race and Age-Related PSA Testing Disparities in Spinal Cord Injured Men: Analysis of National Veterans Health Administration Data
Background: Prostate-specific antigen (PSA) testing remains controversial due to the debate about overdetection and overtreatment. Given the lack of published data regarding PSA testing rates in the population with spinal cord injury (SCI) within the US Department of Veterans Affairs (VA), there is concern for potential disparities and overtesting in this patient population. In this study, we sought to identify and evaluate national PSA testing rates in veterans with SCI.
Methods: Using the VA Informatics and Computing Infrastructure Corporate Data Warehouse, we extracted PSA testing data for all individuals with a diagnosis of SCI. Testing rates were calculated, analyzed by race and age, and stratified according to published American Urological Association guideline groupings for PSA testing.
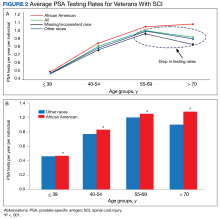
Results: We identified 45,274 veterans at 129 VA medical centers with a diagnosis of SCI who had records of PSA testing in 2000 through 2017. Veterans who were only tested prior to SCI diagnosis were excluded. Final cohort data analysis included 37,243 veterans who cumulatively underwent 261,125 post-SCI PSA tests during the given time frame. Significant differences were found between African American veterans and other races veterans for all age groups (0.47 vs 0.46 tests per year, respectively, aged ≤ 39 years; 0.83 vs 0.77 tests per year, respectively, aged 40-54 years; 1.04 vs 1.00 tests per year, respectively, aged 55-69 years; and 1.08 vs 0.90 tests per year, respectively, aged ≥ 70 years; P < .001).
Conclusions: Significant differences exist in rates of PSA testing in persons with SCI based on age and race. High rates of testing were found in all age groups, especially for African American veterans aged ≥ 70 years.
Results
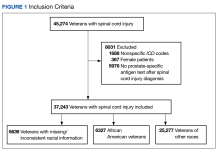
A total of 45,274 veterans were initially identified of which 367 females were excluded (Figure 1).
The PSA testing rate rose for veterans in the age groups ≤ 39, 40 to 54, and 55 to 69 years (Figure 2A).
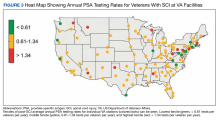
Of the cohort of 37,243 veterans, 28,396 (76.2%) had their post-SCI tests done at a single facility, 6770 (18.1%) at 2 locations, and 2077 (5.5%) at > 2 locations. Single-station group data were included in a subanalysis to determine the mean (SD) PSA testing rates, which for the 123 locations was 0.98 (0.36) tests per veteran per year (range, 0.2-3.0 tests per veteran per year).
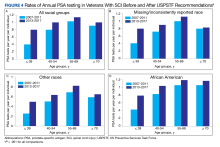
To assess the impact of the 2012 USPSTF recommendations on PSA testing rates in veterans with SCI, mean PSA testing rates were calculated for 5 years before the recommendations (2007-2011) and compared with the average PSA testing rate for 5 years following the updated recommendations (2013-2017). The USPSTF updated its recommendation again in 2018 and acknowledged the potential benefit for PSA screening in certain patient populations.2,3 Surprisingly, and despite recommendations, the results show a significant increase in PSA testing rates in all age groups for all races (P < .001) (Figure 4).


