Advanced Hemodynamic and Cardiopulmonary Ultrasound for Critically Ill Patients in the Emergency Department


Focused echocardiography, advanced hemodynamic, and cardiopulmonary point-of-care ultrasound studies provide time-sensitive evaluation of critically ill patients, guiding and facilitating earlier implementation of life-preserving treatment and supportive therapies.
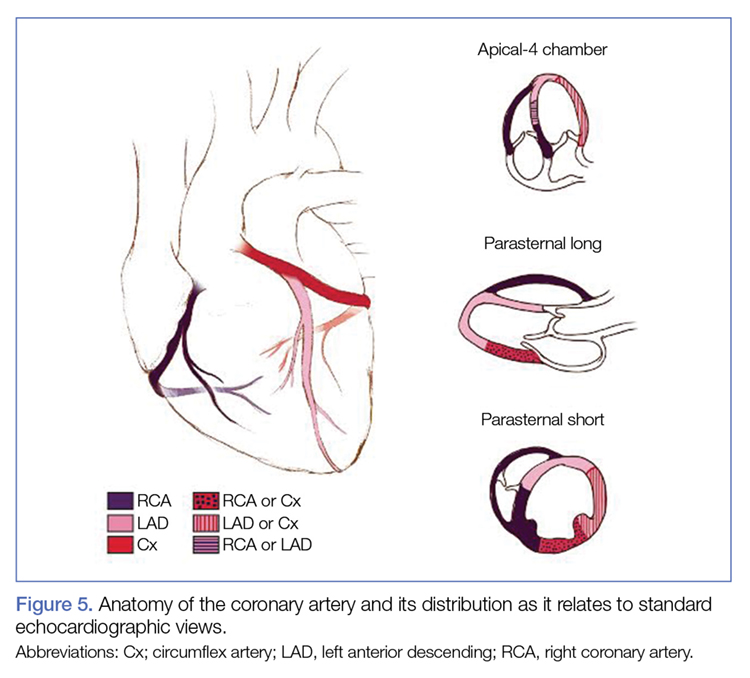
Regional Wall-Motion Abnormalities
Regional wall-motion abnormalities can be evaluated by considering and correlating the coronary artery distributions with the electrocardiographic findings and the clinical scenario (Figure 5).
Simpson’s Rule
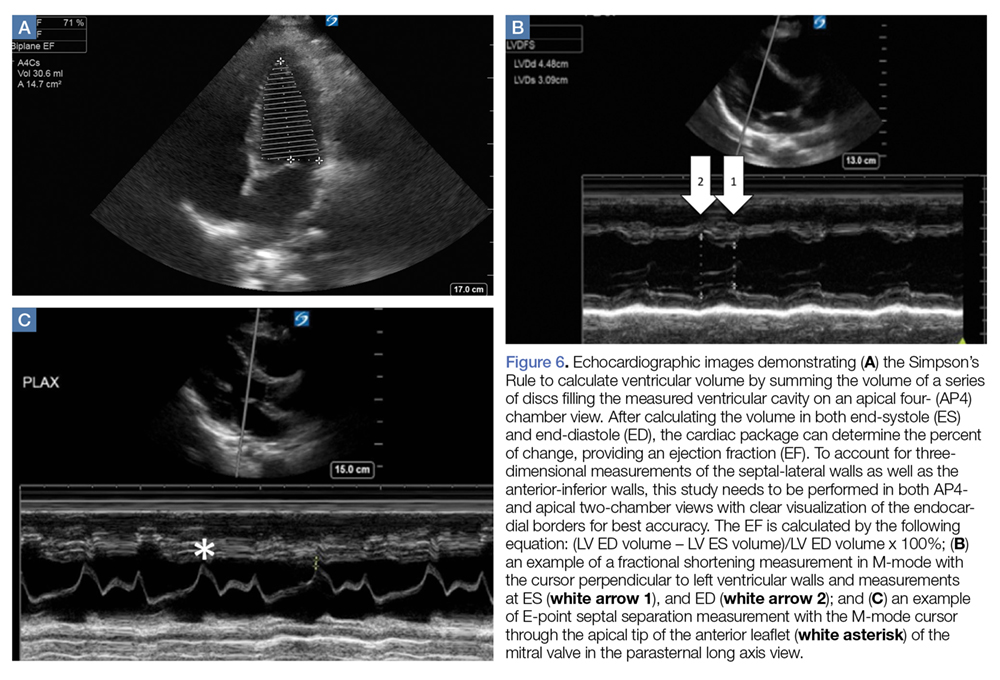
Although no one parameter can quantitatively assess LV function, the EF is the one most commonly used. The Simpson’s Rule or the “method of disks” estimates EF by changes in calculated ventricular volumes. The endocardial border is outlined in end-diastole and end-systole (ES) in both the apical four- (AP4) and two-chamber views. The cardiac package on the ultrasound system can divide the selected area into a series of disks, calculate the volume of each disk, and then add these figures to estimate the ventricular volume (Figure 6a). Limitations of this study include potentially difficult visualization of the endocardial border, and the length of time to conduct this study.
Fractional Shortening
M-mode ultrasound can be used in several ways to estimate LV EF. Fractional shortening (FS) estimates the size reduction of the LV during systole. In the parasternal long axis (PLAX) view, the M-mode cursor is placed over the walls of the LV, just apical to the tips of the mitral valve (MV) leaflets (Figure 6b). Maximal (end-diastolic diameter [EDD]) and minimal (end-systolic diameter [ESD]) dimensions of the LV are measured and FS is calculated as (LVEDD – LVESD)/ LVEDD. A normal value is more than 25%, and a rough estimate of EF is FS x 2.24 Limitations to this study include nonplacement of the M-mode cursor perpendicular to the LV walls, and inaccuracy in patients with regional wall abnormalities.
E-Point Septal Separation
Another way to assess EF with POCUS is through E-point septal separation (EPSS), which uses the movement of the MV during diastole to estimate the EF during systole. In the PLAX view, the M-mode cursor is placed over the apical tip of the anterior leaflet of the MV to visualize the movement of the leaflet in relation to the interventricular septum (Figure 6c). Two characteristic waves are created during each diastole—the larger first wave representing early filling (the E-wave) and the smaller second wave representing the atrial kick (the A-wave). The E-point is the tallest point of the E-wave, and the EPSS is measured as the distance in millimeters between the E-point and the interventricular septum.21
The opening of the anterior leaflet of the MV toward the interventricular septum in diastole requires a pressure difference between the left atrium (LA) and LV. In a patient with poor LV systolic function, the LV is still full at the end of systole, the pressure difference is not as great, and the mitral leaflets will not snap open vigorously. The EPSS should be at or less than 6 mm in patients with normal LV systolic function. An EPSS of 6 to 12 mm suggests moderately depressed LV systolic function, and over 12 mm signifies severely decreased LV systolic function.25 Limitations include inaccuracy in patients with valvular abnormalities, such as mitral stenosis or aortic regurgitation, severe LV or septal hypertrophy, regional wall abnormalities or severe LV dilation, limited data, and a wide margin of error when comparing to magnetic resonance imaging measurement of EF.
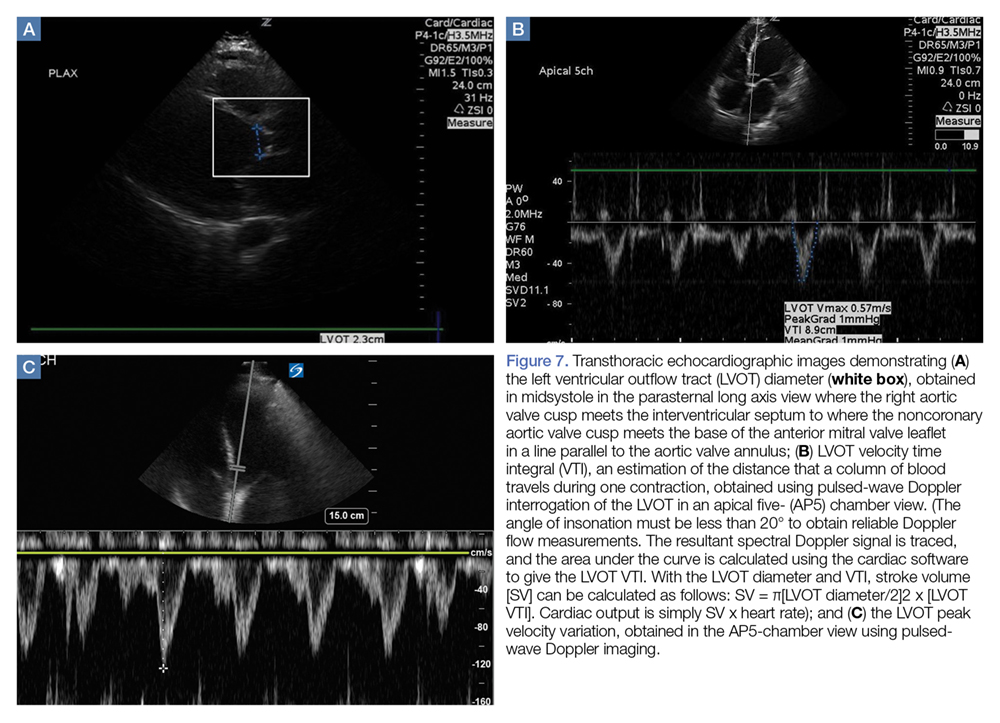
Cardiac Output
Left Ventricular Diastolic Assessment
In an aging population of patients who have longstanding, undiagnosed, or untreated hypertension, LV hypertrophy leads to impaired relaxation and diastolic filling, eventually causing elevated LA pressure and, in extreme cases, restrictive cardiomyopathy. It has been reported that approximately half of all symptomatic patients with heart failure have a preserved EF.27
Determination of LV pressures allows for the distinction between hydrostatic pulmonary edema and ARDS. Diagnosing elevated LA pressure is not inconsequential, as diastolic dysfunction in septic patients has been associated with increased mortality, likely due to increased pulmonary edema from fluid resuscitation.19 An invasive method of using a pulmonary artery catheter and measuring the pulmonary artery occlusion pressure to estimate the LA pressure is the gold standard, but is no longer routinely performed.
Echocardiography is a noninvasive surrogate to estimating LA and LV filling pressures. Two different echocardiographic measurements can be used in conjunction to estimate LV filling pressures: MV inflow velocity and tissue Doppler imaging.