Meta-analysis: Its strengths and limitations
ABSTRACTNowadays, doctors face an overwhelming amount of information, even in narrow areas of interest. In response, reviews designed to summarize the large volumes of information are frequently published. When a review is done systematically, following certain criteria, and the results are pooled and analyzed quantitatively, it is called a meta-analysis. A well-designed meta-analysis can provide valuable information for researchers, policy-makers, and clinicians. However, there are many critical caveats in performing and interpreting them, and thus many ways in which meta-analyses can yield misleading information.
KEY POINTS
- Meta-analysis is an analytical technique designed to summarize the results of multiple studies.
- By combining studies, a meta-analysis increases the sample size and thus the power to study effects of interest.
- There are many caveats in performing a valid meta-analysis, and in some cases a meta-analysis is not appropriate and the results can be misleading.
HETEROGENEITY OF RESULTS
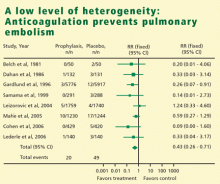
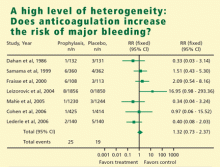
In meta-analysis, heterogeneity refers to the degree of dissimilarity in the results of individual studies. In some cases, the dissimilarities in results can be traced back to inherent differences in the individual studies. In other situations, however, causes for the dissimilarities might not be easy to elucidate. In any case, as the level of heterogeneity increases, the justification for an integrated result becomes more difficult. A tool that is very effective to display the level of heterogeneity is the forest plot. In a forest plot, the estimated effect of each study along with a line representing a confidence interval is drawn. When the effects are similar, the confidence intervals overlap, and heterogeneity is low. The forest plot includes a reference line at the point of no effect (eg, one for relative risks and odds ratios). When some effects lie on opposite sides of the reference line, it means that the studies are contradictory and heterogeneity is high. In such cases, the conclusions of a meta-analysis are compromised.
AVAILABILITY OF INFORMATION
Most reports of individual studies include only summary results, such as means, standard deviations, proportions, odds ratios, and relative risks. Other than the possibility of errors in reporting, the lack of information can severely limit the type of analyses and conclusions that can be reached in a meta-analysis. For example, lack of information from individual studies can preclude the comparison of effects in predetermined subgroups of patients.
The best scenario is when data at the patient level are available. In such cases, the researcher has great flexibility in the analysis of the information. Trivella et al20 performed a meta-analysis of the value of microvessel density in predicting survival in non-small-cell lung cancer. They obtained information on individual patients by contacting research centers directly. The data allowed them to vary the cutoff point to classify microvessel density as high or low and to use statistical methods to ameliorate heterogeneity.
A frequent problem in meta-analysis is the lack of uniformity in how outcomes are measured. In the study by Trivella et al,20 the microvessel density was measured by two methods. The microvessel density was a significant prognostic factor when measured by one of the methods, but not the other.
RANDOMIZED CONTROLLED TRIALS VS OBSERVATIONAL STUDIES
Some researchers believe that meta-analyses should be conducted only on randomized controlled trials.3,21 Their reasoning is that meta-analyses should include only reasonably well-conducted studies to reduce the risk of a misleading conclusion. However, many important diseases can only be studied observationally. If these studies have a certain level of quality, there is no technical reason not to include them in a meta-analysis.
Gillum et al22 performed a meta-analysis published in 2000 on the risk of ischemic stroke in users of oral contraceptives, based on observational studies (since no randomized trials were available). Studies were identified and selected by multiple researchers using strict criteria to make sure that only studies fulfilling certain standards were included. Of 804 potentially relevant studies identified, only 16 were included in the final analysis. A funnel plot showed no evidence of bias and the level of heterogeneity was fairly low. The meta-analysis result confirmed the results of individual studies, but the precision with which the effect was estimated was much higher. The overall relative risk of stroke in women taking oral contraceptives was 2.75, with a 95% confidence interval of 2.24 to 3.38.
A more recent meta-analysis23 (published in 2004) on the same issue found no significant increase in the risk of ischemic stroke with the use of oral contraceptives. Gillum and Johnston24 suggest that the main reason for the discrepancy is the lower amount of estrogen in newer oral contraceptives. They also point out differences in the control groups and study outcomes as reasons for the discrepancies between the two studies.
Bhutta et al25 performed a meta-analysis of case-control (observational) studies of the effect of preterm birth on cognitive and behavioral outcomes. Studies were included only if the children were evaluated after their fifth birthday and the attrition rate was less than 30%. The studies were grouped according to criteria of quality devised specifically for case-control studies. The high-quality studies tended to show a larger effect than the low-quality studies, but the difference was not significant. Seventeen studies were included, and all of them found that children born preterm had lower cognitive scores; the difference was statistically significant in 15 of the studies. As expected, the meta-analysis confirmed these findings (95% confidence interval for the difference 9.2–12.5). The number of patients (1,556 cases and 1,720 controls) in the meta-analysis allowed the researchers to conclude further that the mean cognitive scores were directly proportional to the mean birth weight (R2 = 0.51, P < .001) and gestational age (R2 = 0.49, P < .001).


