Meta-analysis: Its strengths and limitations
ABSTRACTNowadays, doctors face an overwhelming amount of information, even in narrow areas of interest. In response, reviews designed to summarize the large volumes of information are frequently published. When a review is done systematically, following certain criteria, and the results are pooled and analyzed quantitatively, it is called a meta-analysis. A well-designed meta-analysis can provide valuable information for researchers, policy-makers, and clinicians. However, there are many critical caveats in performing and interpreting them, and thus many ways in which meta-analyses can yield misleading information.
KEY POINTS
- Meta-analysis is an analytical technique designed to summarize the results of multiple studies.
- By combining studies, a meta-analysis increases the sample size and thus the power to study effects of interest.
- There are many caveats in performing a valid meta-analysis, and in some cases a meta-analysis is not appropriate and the results can be misleading.
Search bias: Identifying relevant studies
Even in the ideal case that all relevant studies were available (ie, no publication bias), a faulty search can miss some of them. In searching databases, much care should be taken to assure that the set of key words used for searching is as complete as possible. This step is so critical that most recent meta-analyses include the list of key words used. The search engine (eg, PubMed, Google) is also critical, affecting the type and number of studies that are found.7 Small differences in search strategies can produce large differences in the set of studies found.8
Selection bias: Choosing the studies to be included
The identification phase usually yields a long list of potential studies, many of which are not directly relevant to the topic of the meta-analysis. This list is then subject to additional criteria to select the studies to be included. This critical step is also designed to reduce differences among studies, eliminate replication of data or studies, and improve data quality, and thus enhance the validity of the results.
To reduce the possibility of selection bias in this phase, it is crucial for the criteria to be clearly defined and for the studies to be scored by more than one researcher, with the final list chosen by consensus.9,10 Frequently used criteria in this phase are in the areas of:
- Objectives
- Populations studied
- Study design (eg, experimental vs observational)
- Sample size
- Treatment (eg, type and dosage)
- Criteria for selection of controls
- Outcomes measured
- Quality of the data
- Analysis and reporting of results
- Accounting and reporting of attrition rates
- Length of follow-up
- When the study was conducted.
The objective in this phase is to select studies that are as similar as possible with respect to these criteria. It is a fact that even with careful selection, differences among studies will remain. But when the dissimilarities are large it becomes hard to justify pooling the results to obtain a “unified” conclusion.
In some cases, it is particularly difficult to find similar studies,10,11 and sometimes the discrepancies and low quality of the studies can prevent a reasonable integration of results. In a systematic review of advanced lung cancer, Nicolucci et al12 decided not to pool the results, in view of “systematic qualitative inadequacy of almost all trials” and lack of consistency in the studies and their methods. Marsoni et al13 came to a similar conclusion in attempting to summarize results in advanced ovarian cancer.
Stratification is an effective way to deal with inherent differences among studies and to improve the quality and usefulness of the conclusions. An added advantage to stratification is that insight can be gained by investigating discrepancies among strata.
There are many ways to create coherent subgroups of studies. For example, studies can be stratified according to their “quality,” assigned by certain scoring systems. Commonly used systems award points on the basis of how patients were selected and randomized, the type of blinding, the dropout rate, the outcome measurement, and the type of analysis (eg, intention-to-treat). However, these criteria, and therefore the scores, are somewhat subjective. Moher et al14 expand on this issue.
Large differences in sample sizes among studies are not uncommon and can cause problems in the analysis. Depending on the type of model used (see below), meta-analyses combine results based on the size of each study, but when the studies vary significantly in size, the large studies can still have an unduly large influence on the results. Stratifying by sample size is done sometimes to verify the stability of the results.4
On the other hand, the presence of dissimilarities among studies can have advantages by increasing the generalizability of the conclusions. Berlin and Colditz1 point out that “we gain strength in inference when the range of patient characteristics has been broadened by replicating findings in studies with populations that vary in age range, geographic region, severity of underlying illness, and the like.”
Funnel plot: Detecting biases in the identification and selection of studies
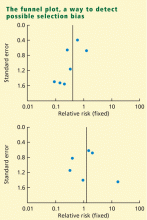
The funnel plot is a technique used to investigate the possibility of biases in the identification and selection phases. In a funnel plot the size of the effect (defined as a measure of the difference between treatment and control) in each study is plotted on the horizontal axis against standard error15 or sample size9 on the vertical axis. If there are no biases, the graph will tend to have a symmetrical funnel shape centered in the average effect of the studies. When negative studies are missing, the graph shows lack of symmetry.
Funnel plots are appealing because they are simple, but their objective is to detect a complex effect, and they can be misleading. For example, lack of symmetry in a funnel plot can also be caused by heterogeneity in the studies.16 Another problem with funnel plots is that they are difficult to interpret when the number of studies is small. In some cases, however, the researcher may not have any option but to perform the analysis and report the presence of bias.11


