Clinical Impact of Initiation of U-500 Insulin vs Continuation of U-100 Insulin in Subjects With Diabetes


Background: The prevalence of obesity and diabetes mellitus (DM ) has each increased drastically according to the Centers for Disease Control and Prevention. Growth of severe insulin-resistant DM is predicted. U-500 insulin is highly concentrated and can replace less concentrated formulations in patients that need high insulin dosages. The aim of this study was to compare clinical outcomes of U-500 and U-100 insulin regimens in veterans with obesity and insulin-resistance.
Methods: A single-site retrospective chart analysis of adult subjects was conducted from July 2002 to June 2011. Data for repeated measures spanned a period from 3 months before the intervention (baseline) through 12 months afterward. The main outcome was the variation in hemoglobin A1C (Hb A1C). Other outcomes included incidence of severe hypoglycemia, weight changes, cardiovascular events, and number of injections.
Results: A total of 142 subjects (68 taking U-500 and 74 taking U-100) were included. Baseline characteristics were similar between groups, except for weight, which was higher among U-500 subjects. Mean Hb A1C was reduced by 0.84% and 0.56% in U-500 and U-100, respectively (P = .003). Severe hypoglycemia occurred in 5 subjects in U-500 and 1 in U-100 ( P = .08). No significant difference was noted in the number of CV events. Mean number of daily injections was 2 in the U-500 group, and 4 in the U-100 group (P < .001).
Conclusions: U-500 insulin compared with U-100 insulin regimens led to a statistically significant reduction in Hb A1C and number of insulin injections. Additional research is necessary to assess the risk of severe hypoglycemia in U-500 users. Neither regimen was associated with increased cardiovascular risk.
Data Collection
Data were collected using the automatic data mining tools within the JAHVA Computerized Patient Record System and confirmed individually by clinical staff. Demographic data included age, race, and sex. Other parameters were weight; BMI; Hb A1C; estimated glomerular filtration rate (eGFR); duration of DM; use of metformin and other oral agents; total daily insulin dose; number of daily injections; prior history of atherosclerotic cardiovascular disease (ASCVD), including coronary artery disease (CAD), cerebrovascular accident (CVA), or peripheral vascular disease (PVD); occurrence of severe hypoglycemia (symptomatic hypoglycemia requiring treatment assistance from another individual) and of new cardiovascular events, classified as CAD, CVA, or PVD.
For the U-500 group, data were collected and analyzed for the 3 months before (baseline) and the 12 months after the initiation of concentrated insulin. For the U-100 group, data were collected and analyzed for the comparable 3 months before (baseline) and the 12 months after the first clinic visit in which the subject started using more than 200 units per day of U-100. Frequency of follow-up visits was individualized according to clinical needs.
Clinical Endpoints
Primary outcomes included changes in Hb A1C from baseline to the following 12 months, and the occurrence of severe hypoglycemia. Secondary outcomes included the occurrence of new ASCVD events during the study, and changes in weight, BMI, and number of injections.
Statistical Analysis
The primary and secondary outcomes were assessed through univariate and multivariate general linear models. Multivariate models were used to compare differences in the variation of Hb A1C over time. Data were incomplete for the Hb A1C in 27 subjects, 6% of the dataset (Each subject had more than one variable or observation). Therefore, a multiple imputation was used to account for the incompleteness on Hb A1C (value substitutions by the mean and by the prior Hb A1C and models were balanced against the unaltered data). A P value of ≤ .05 was used to determine statistical significance. The statistical analyses were performed using IBM SPSS Statistics 21.
Results
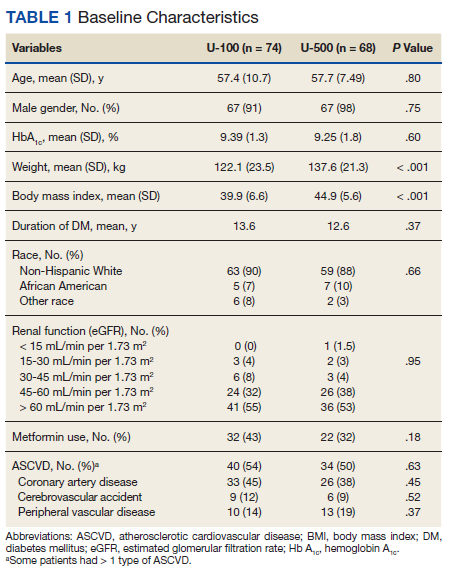
Most patients were male (94%) of white race (86%), with a mean age of 57 years and comparable duration of DM (Table 1). Demographics were balanced between the groups, except for weight and BMI, both higher in the U-500 group (P < .001). Use of oral antidiabetic agents was not significantly different between groups, nor were comorbid conditions, with nearly 50% of subjects in each group affected by CKD and ASCVD, of which CAD was the most common (approximately 40% of both groups). Only about one-third of subjects used metformin and/or other oral agents, likely due to the high prevalence of CKD (contraindicating metformin) and high insulin requirements (due to correlation with β cell failure). A subgroup analysis of subjects on metformin did not demonstrate significant differences in risk of severe hypoglycemia or in Hb A1C levels (data not shown).
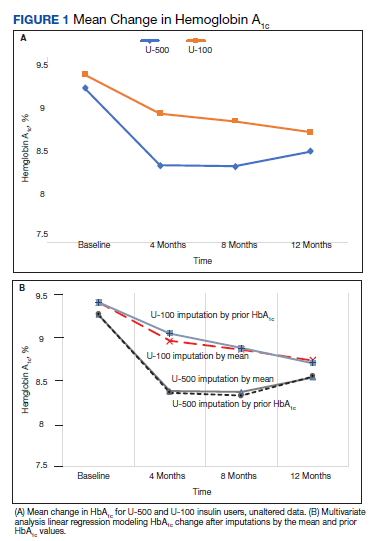
Both groups had similar initial Hb A1C baselines (> 9%) and both improved glycemic control during the study period. However, the Hb A1C reduction was greater in the U-500 group (P= .034), 0.84% vs 0.56% for U-100 and the between-groups difference was 0.4%. (Figure 1, Tables 2 and 3).
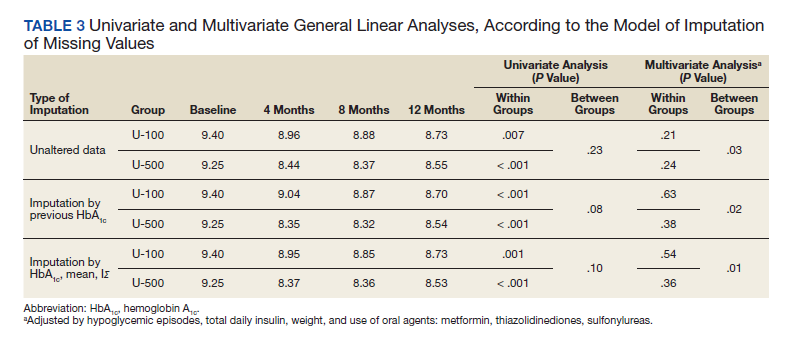
The univariate general linear model shows a statistically significant difference in the levels of Hb A1C within each treatment group, regardless of the imputation strategy. However, the differences were not significant when comparing postintervention Hb A1C means between groups with unaltered data (P = .23), because the U-500 group Hb A1C improvement gap narrowed at the end of study. In the multivariate analysis, irrespective of imputation method, the differences in Hb A1C between group treated with U-100 and U-500 were statistically significant (Table 3).
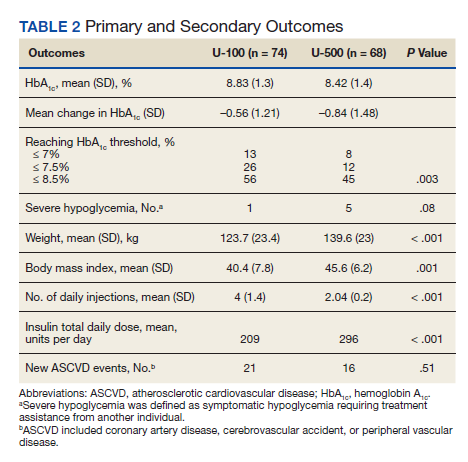
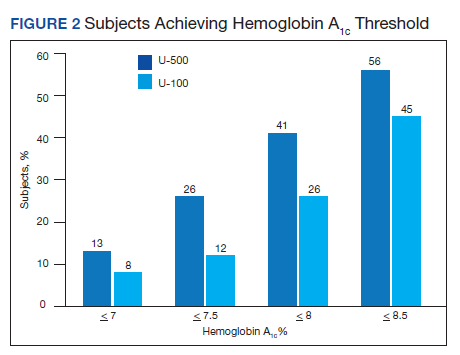
Overall, more subjects in the U-500 group than in the U-100 group achieved Hb A1C levels < 8.5% (56% vs 46%, respectively, P = .003) and the proportion of subjects achieving Hb A1C levels < 7.5% doubled that of the U-100 group (26% vs 12%; Figure 2). Five subjects in the U-500 group experienced severe hypoglycemia, compared with 1 in the U-100 group (P = .08). The total daily insulin dose was significantly higher in the U-500 group (296 units daily) than in the U-100 group (209 units daily) (P < .001) (Table 2). Baseline weight and BMI differences were also significant for the U-500 and U-100 groups (P < .001). Weight gain of approximately 2 kg occurred in both groups, a change that was not statistically significant (P = .79)
There were 21 new ASCVD events in the U-100 and 16 in the U-500 group (P = .51) and there were no statistically significant differences in the incidence of new CAD, PVD or CVA events. The U-500 group required significantly fewer injections than U-100 insulin users (2 vs 4; P < .001).