
Is patient-choice primary cesarean rational?



If—and only if—the patient brings up the subject, says NIH, go ahead and counsel her on risks and benefits
IN THIS ARTICLE
BREAKING NEWS
The cesarean delivery rate in the US reached an acme in 2004 at 29.1% of all deliveries. Both the total cesarean rate and the primary cesarean rate have increased each year since 1996. Primary cesarean delivery accounted for 20.6% of all deliveries in 2004—a 40% rise over a decade.12,26
More cesareans, fewer VBACs
Vaginal birth after cesarean has declined from 28.3% to 9.2% since 1996.26 In 2004, 91% of women with 1 cesarean delivery were likely to have repeat cesarean in subsequent deliveries.27
Trend is up in other countries, too
Most developed countries are also seeing increasing cesarean delivery rates. For example, in the United Kingdom, the overall cesarean delivery rate was 23% in 2003–2004, up from 17% in 1996–1997.28 In New South Wales, Australia, the overall cesarean delivery rate was 23.5% in 2001, up from 17.6% in 1996.29 Data from other countries are older, but typically show increases.
Older “no-risk” gravidas—44% more c-sections For age 35 and older, primiparous women with “no indicated risk” had the greatest frequency of cesarean, according to 1991–2001 US birth certificate data30: 44.2% in 2001—a 44% rise in 10 years.
US trend in cesarean rates per 100 live births
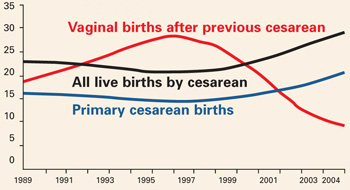
Data for 2003–2004 are preliminary. Due to changes in data collection from implementation of the 2003 revision of the US Standard Certificate of Live Birth, there may be small discontinuities in primary cesarean delivery and VBAC rates in 2003–2004.
SOURCE: Agency for Health Care Research and Quality27
For all ages, primiparous women with no indicated risk had a cesarean delivery rate of 5.5%—a 68% increase in 10 years.
A study from Scotland did report the cesarean delivery rate specifically for “maternal request”: 7.7% in the late 1990s.31


