Methodological Progress Note: Classification and Regression Tree Analysis


© 2020 Society of Hospital Medicine
Machine-learning is a type of artificial intelligence in which systems automatically learn and improve from experience without being explicitly programmed. Classification and Regression Tree (CART) analysis is a machine-learning algorithm that was developed to visually classify or segment populations into subgroups with similar characteristics and outcomes. CART analysis is a decision tree methodology that was initially developed in the 1960s for use in product marketing.1 Since then, a number of health disciplines have used it to isolate patient subgroups from larger populations to guide clinical decision-making by better identifying those most likely to benefit.2 The clinical utility of CART mirrors how most clinicians think, which is not in terms of coefficients (ie, regression output) but rather in terms of categories or classifications (eg, low vs high risk).
In this issue of the Journal of Hospital Medicine, Young and colleagues use classification trees to predict discharge placement (postacute care facility vs home) based on a patient’s hospital admission characteristics and mobility score. The resulting decision tree indicates that patients with the lowest mobility scores, as well as those 65 years and older, were most likely to be discharged to postacute care facilities.3 In this review, we orient the reader to the basics of CART analysis, discuss important intricacies, and weigh its pros, cons, and application as a statistical tool.
WHAT IS CART ANALYSIS?
CART is a nonparametric (ie, makes no assumptions about data distribution) statistical tool that identifies subgroups within a population whose members share common characteristics as defined by the independent variables included in the model. CART analysis is unique in that it yields a visual output of the data in the form of a multisegmented structure that resembles the branches of a tree (Figure). CART analysis consists of four basic steps: (1) tree-building (including splitting criteria and estimation of classification error), (2) stopping the tree-building process, (3) tree “pruning,” and (4) tree selection.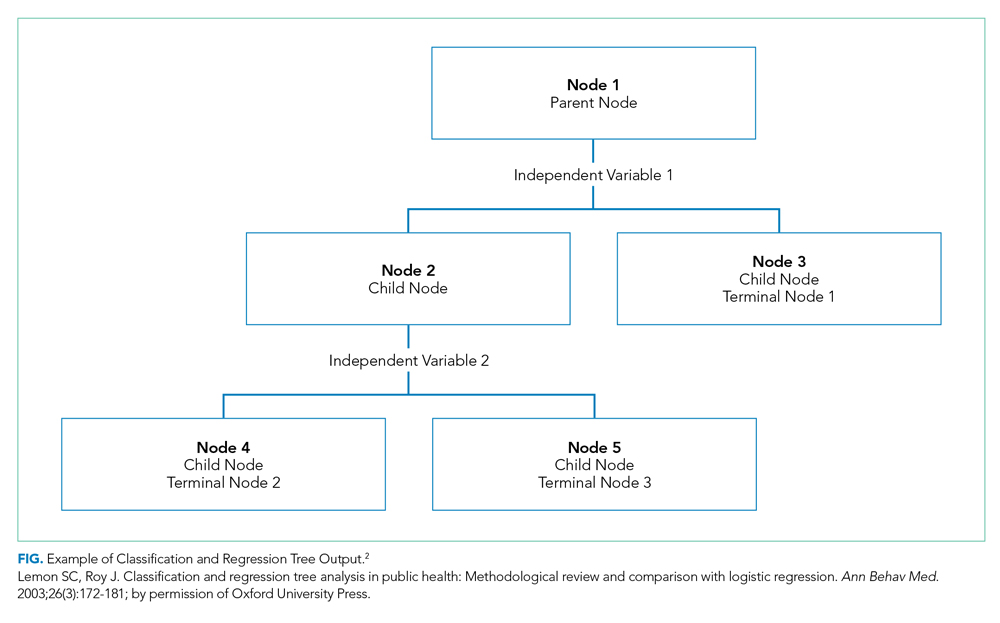
In general, CART analysis begins with a single “node” or group, which contains the entire sample population. This is referred to as the “parent node.” The CART procedure simultaneously examines all available independent variables and selects one that results in two groups that are the most distinct with respect to the outcome variable of interest. In Young et al’s example, posthospital discharge placement is the outcome.3 This parent node then branches into two “child nodes” according to the independent variable that was selected. Within each of these “child nodes,” the tree-growing methodology recursively assesses each of the remaining independent variables to determine which will result in the best split according to the chosen splitting criterion.2 Each subsequent “child node” will become a “parent node” to the two groups in which it splits. This process is repeated on the data in each subsequent “child node” and is stopped once a predefined stopping point is reached. Notably, while division into two groups is the most common application of CART modeling, there are models that can split data into more than two child nodes.
Since CART outcomes can be heavily dependent on the data being used (eg, electronic health records or administrative data), it is important to attempt to confirm results in a similar, but different, study cohort. Because obtaining separate data sources with similar cohorts can be difficult, many investigators using CART will utilize a “split sample approach” in which study data are split into separate training and validation sets.4 In the training set, which frequently comprises two-thirds of the available data, the algorithm is tested in exploratory analysis. Once the algorithm is defined and agreed upon, it is retested within a validation set, constructed from the remaining one-third of data. This approach, which Young et al utilize,3 allows for improved confidence and reduced risk of bias in the findings and allows for some degree of external validation. Further, the split sample approach supports more reliable measures of predictive accuracy: in Young et al’s case, the proportion of correctly classified patients discharged to a postacute care facility (sensitivity: 58%, 95% CI 49-68%) and the proportion of correctly classified patients discharged home (specificity: 84%, 95% CI 78-90%). Despite these advantages, the split sample approach is not universally used.