Surgical Comanagement by Hospitalists: Continued Improvement Over 5 Years


Neurosurgery services in which the same Internal Medicine hospitalists are dedicated year round to each of these surgical services to proactively prevent and manage medical conditions. In this article, we evaluate if SCM was associated with continued improvement in patient outcomes between 2012 and 2018 in Orthopedic and Neurosurgery services at our institution. We conducted regression analysis on 26,380 discharges to assess yearly change in our outcomes. Since 2012, the odds of patients with ≥1 medical complication decreased by 3.8% per year (P = .01), the estimated length of stay decreased by 0.3 days per year (P < .0001), and the odds of rapid response team calls decreased by 12.2% per year (P = .001). Estimated average direct cost savings were $3,424 per discharge.
© 2020 Society of Hospital Medicine
Outcomes
Our primary outcome was proportion of patients with ≥1 medical complication (sepsis, pneumonia, urinary tract infection, delirium, acute kidney injury, atrial fibrillation, or ileus). Our secondary outcomes included mean LOS, proportion of patients with ≥2 medical consultations, rapid response team calls, code blues, and top-box patient satisfaction score. Though cost is an important consideration in implementing SCM, limited financial data were available. However, since LOS is a key component in calculating direct costs,6 we estimated the cost savings per discharge using mean direct cost per day and the difference in mean LOS between pre- and post-SCM groups.5
We defined medical complications using International Classification of Disease (ICD) Codes 9 or 10 that were coded as “not present on admission” (Appendix 1). We used Hospital Consumer Assessment of Healthcare Providers and Systems (HCAHPS) survey for three questions for patient satisfaction: Did doctors treat with courtesy and respect, listen carefully, and explain things in a way you could understand?
Statistical Analysis
We used regression analysis to assess trends in patient characteristics by year (Appendix 2). Logistic regression with logit link was used to assess the yearly change in our binary outcomes (proportion of patients with ≥1 medical complication, those with ≥2 medical consultations, rapid response team calls, code blue, and top-box patient satisfaction score) and reported odds ratios. Gamma regression with identity link was performed for our continuous outcome (LOS). Beta coefficient was reported to estimate the yearly change in LOS under their original scales. Age, primary insurance, race, Charlson comorbidity score, general or regional anesthesia, surgical service, and duration of surgery were adjusted in the regression analyses for outcomes. SAS 9.4 was used for analysis.
RESULTS
Patient characteristics are shown in Table 1. Overall, 62.8% patients were discharged from Orthopedic surgery service, 72.5% patients underwent elective surgery, and 88.8% received general anesthesia. Between 2012 and 2018, there was a significant increase in the median age of patients (from 60 years to 63 years), mean Charlson comorbidity score increased from 1.07 to 1.46, and median case mix index, a measure of patient acuity, increased from 2.10 to 2.36 (Appendix 2).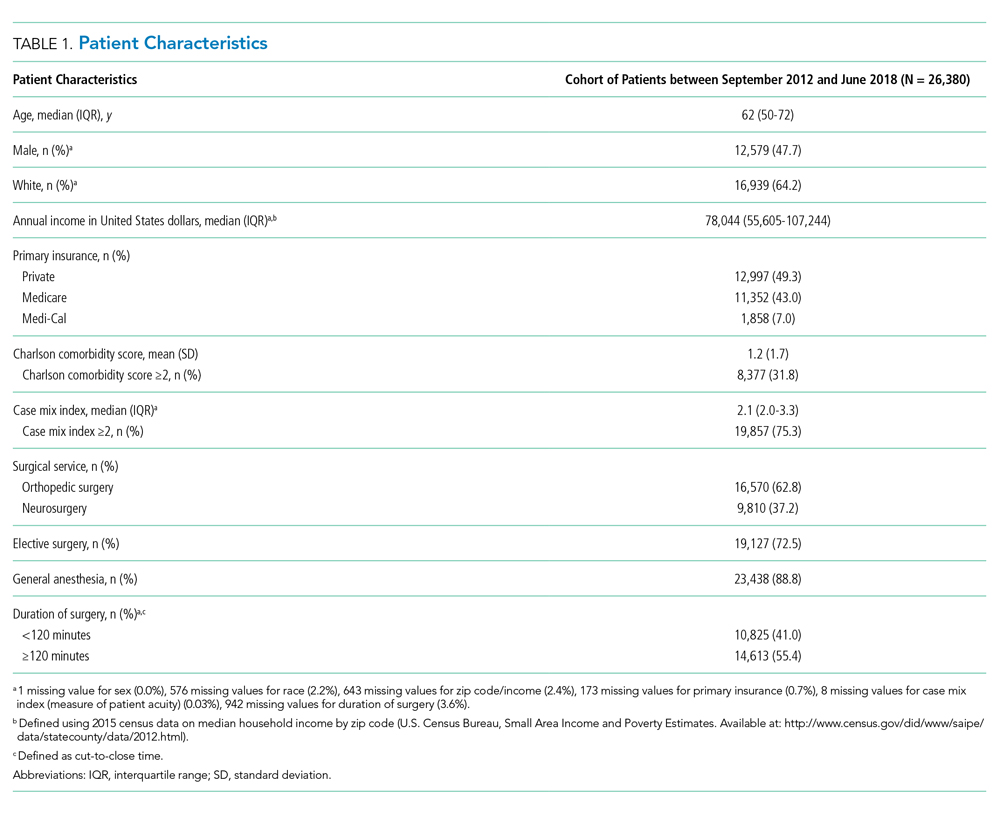
Comparing pre-SCM unadjusted rates reported in our prior study (January 2009 to July 2012) to post-SCM (September 2012 to June 2018; Appendix 3), patients with ≥1 medical complication decreased from 10.1% to 6.1%, LOS (mean ± standard deviation) changed from 5.4 ± 2.2 days to 4.6 ± 5.8 days, patients with ≥2 medical consultations decreased from 19.4% to 9.2%, rapid response team calls changed from 1% to 0.9%, code blues changed from 0.3% to 0.2%, and patients with top-box patient satisfaction score increased from 86.4% to 94.2%.5
In the adjusted analysis from 2012 to 2018, the odds of patients with ≥1 medical complication decreased by 3.8% per year (P = .01), estimated LOS decreased by 0.3 days per year (P < .0001), and the odds of rapid response team calls decreased by 12.2% per year (P = .001; Table 2). Changes over time in the odds of patients with ≥2 medical consultations, code blues, or top-box patient satisfaction score were not statistically significant (Table 2). Based on the LOS reduction pre- to post-SCM, there were estimated average direct cost savings of $3,424 per discharge between 2012 and 2018.
