Describing Variability of Inpatient Consultation Practices: Physician, Patient, and Admission Factors


Appropriate use of consultation can improve patient outcomes, but inappropriate use may cause harm. Factors affecting the variability of inpatient consultation are poorly understood. We aimed to describe physician-, patient-, and admission-level factors influencing the variability of inpatient consultations on general medicine services. We conducted a retrospective study of patients hospitalized from 2011 to 2016 and enrolled in the University of Chicago Hospitalist Project, which included 6,153 admissions of 4,772 patients under 69 attendings. Consultation use varied widely; a 5.7-fold difference existed between the lowest (mean, 0.613) and highest (mean, 3.47) quartiles of use (P <.01). In mixed-effect Poisson regression, consultations decreased over time, with 45% fewer consultations for admissions in 2015 than in 2011 (P <.01). Patients on nonteaching hospitalist teams received 9% more consultations than did those on teaching services (P =.02). Significant variability exists in inpatient consultation use. Further understanding may help to identify groups at high-risk for underuse/overuse and aid in the development of interventions to improve high-value care.
© 2020 Society of Hospital Medicine
The outcome variable was the number of consultations per admission, determined by counting the unique number of services creating clinical documentation, and subtracting one for the primary team. If the Medical/Surgical intensive care unit (ICU) was a service, then two were subtracted to account for the ICU transfer.
Attending years in practice (ie, years since medical school graduation) and gender were determined from public resources. Practice characteristics were determined from UCHP attending surveys, which address perceptions of workload and satisfaction (Appendix 2).
Patient characteristics (gender, age, Elixhauser Indices) and admission characteristics (LOS, season of admission, payor) were determined from UCHP and CRI data. The Elixhauser Index uses a well-validated system combining the presence/absence of 31 comorbidities to predict mortality and 30-day readmission.8 Elixhauser Indices were calculated using the “Creation of Elixhauser Comorbidity Index Scores 1.0” software.9 For admissions under hospitalist attendings, teaching/nonteaching team was ascertained via internal teaching service calendars.
Analysis
We used descriptive statistics to examine demographic characteristics. The difference between the lowest and highest quartile consultation use was determined via a two-sample t test. Given the multilevel nature of our count data, we used a mixed-effects Poisson model accounting for within-group variation by clustering on attending and patient (3-level random-effects model). The analysis was done using Stata 15 (StataCorp, Texas).
RESULTS
From 2011 to 2016, 14,848 patients and 88 attendings were enrolled in UCHP; 4,772 patients (32%) and 69 attendings (59.4%) had data available and were included. Mean LOS was 3.0 days (SD = 1.3). Table 1 describes the characteristics of attendings, patients, and admissions.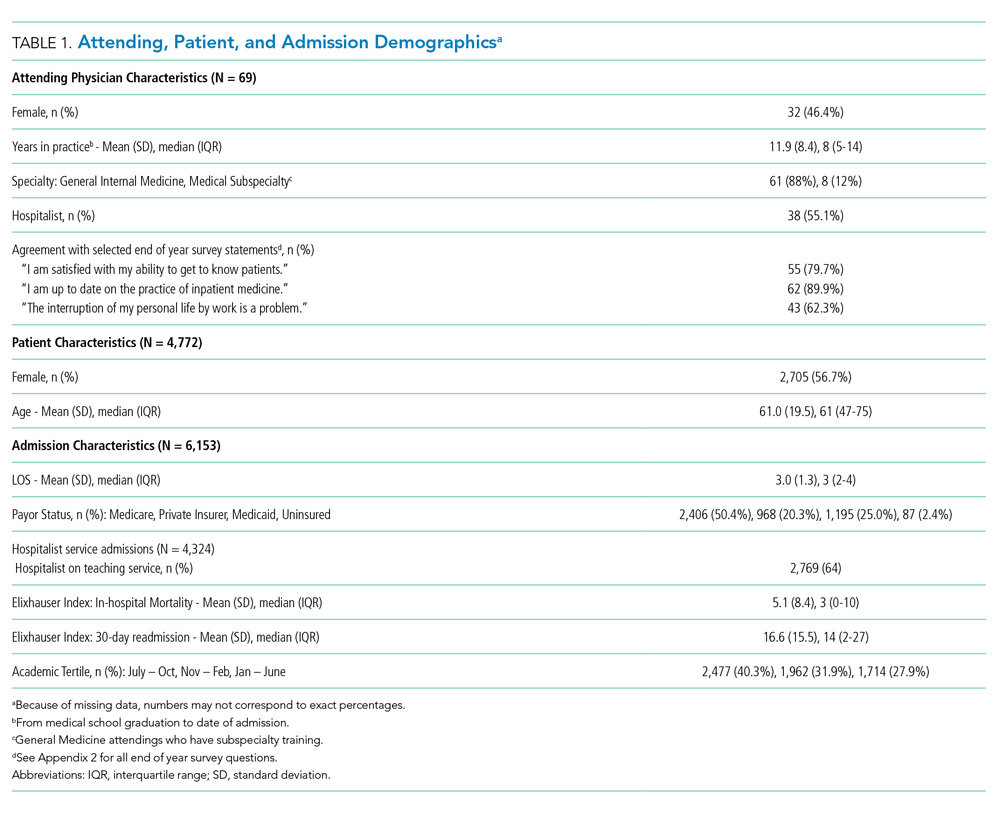
Seventy-six percent of admissions included at least one consultation. Consultation use varied widely, ranging from 0 to 10 per admission (mean = 1.39, median = 1; standard deviation [SD] = 1.17). The number of consultations per admission in the highest quartile of consultation frequency (mean = 3.47, median = 3) was 5.7-fold that of the lowest quartile (mean = 0.613, median = 1; P <.001).
In multivariable regression, physician-, patient-, and admission-level characteristics were associated with the differential use of consultation (Table 2). On teaching services, consultations called by hospitalist vs nonhospitalist generalists did not differ (P =.361). However, hospitalists on nonteaching services called 8.6% more consultations than hospitalists on teaching services (P =.02). Attending agreement with survey item “The interruption of my personal life by work is a problem” was associated with 8.2% fewer consultations per admission (P =.002).
Patients older than 75 years received 19% fewer consultations compared with patients younger than 49 years (P <.001). Compared with Medicare, Medicaid admissions had 12.2% fewer consultations (P <.001), whereas privately insured admissions had 10.7% more (P =.001). The number of consultations per admission decreased every year, with 45.3% fewer consultations in 2015 than 2011 (P <.001). Consultations increased by each 22% per day increase in LOS (P <.001).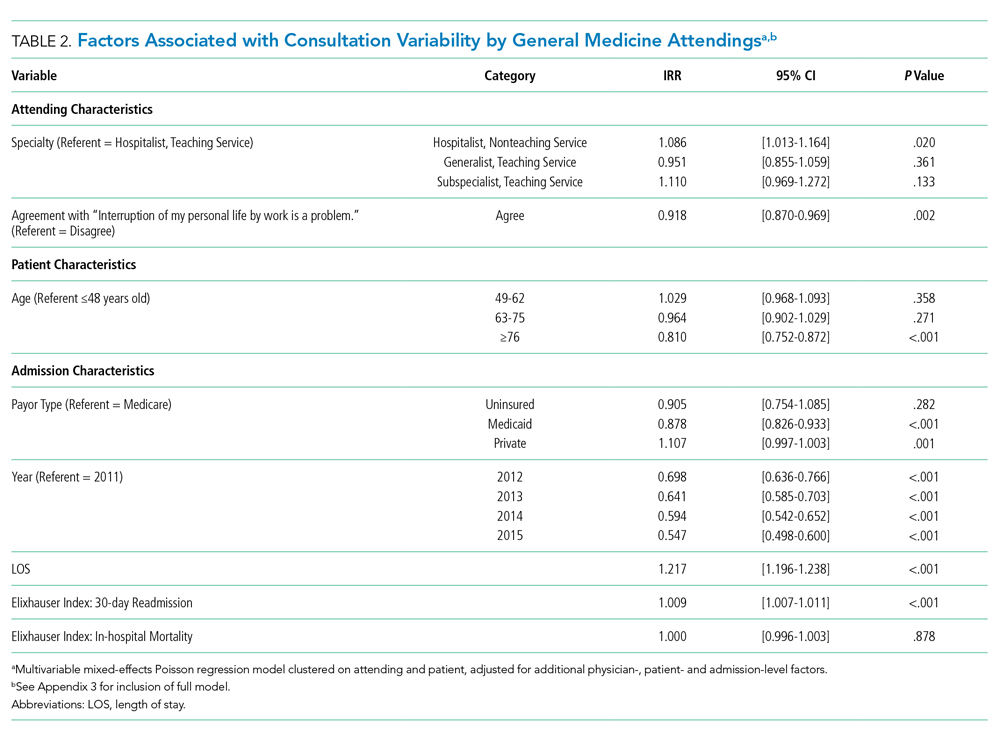
DISCUSSION
Our analysis described several physician-, patient-, and admission-level characteristics associated with the use of inpatient consultation. Our results strengthen prior work demonstrating that patient-level factors alone are insufficient to explain consultation variability.1
