Effect of Hospital Readmission Reduction Program on Hospital Readmissions and Mortality Rates


RATIONALE: Although the Hospital Readmission Reduction Program (HRRP) has reduced the 30-day readmission rates for patients with chronic obstructive pulmonary disease (COPD) across hospitals, the effect of HRRP on hospital mortality remains unknown. Therefore, we examined the association between hospital readmissions and mortality rates for patients discharged with acute exacerbation of COPD (AECOPD).
METHOD: The all-cause hospital-specific 30-day risk-standardized mortality rate (RSMR) and the 30-day risk-standardized readmission rate (RSRR) for patients with COPD from 2010 to 2017 were obtained from the Hospital Compare website. Hospital service area (HSA) information was obtained from the Dartmouth Atlas of Healthcare. The longitudinal relationship between the mortality and readmission rates of a hospital was assessed using mixed linear models.
RESULTS: Of the 3,685 hospitals analyzed, the unadjusted mean RSMRs increased from 7.8% to 8.4% during the study period at a yearly rate of 0.13 (95% CI = 0.12 to 0.14; P < .001), whereas the mean RSRRs declined from 20.7% to 19.6%. When examined according to the baseline readmission rate and interaction with time, each 1% higher-than-baseline readmission rate was associated with a smaller increase in mortality rate by 0.015% (95% CI = −0.02 to −0.01; P < .0001). Inclusion of change in readmissions in the model showed that each 1% decrease in readmission rate was associated with 0.04% (95% CI = −0.01 to −0.06; P = .008) increase in mortality.
CONCLUSION: This hospital-level analysis of AECOPD showed that although the 30-day all-cause readmission rates declined, the mortality rates increased. Hospitals with lower readmission rates had higher mortality rates over time.
© 2019 Society of Hospital Medicine
Statistical Analysis
Data are summarized as mean and standard deviation (SD), median with interquartile range, or frequencies as appropriate. To model the dependence of observations from the same hospital over time, we used mixed linear models with random intercept and slope. A strength of this modeling approach is that it incorporates information from all hospitals even when some hospitals are missing data for some time periods. We reached our final model through stages with increasing model complexity at each stage. In the first stage, we developed an empty model without any covariates to determine the unconditional variance components so that we can partition mortality variance into between- and within-hospital components. In the second stage, we developed an unconditional growth curve model to determine the shape of time trend in mortality over time using linear and quadratic (by including squared time in the model) growth curves. In the third stage, we added baseline readmission rates (from 2010 to 2013) to the model to determine the effect of baseline readmission rate on mortality trends and also examined its interaction with time and squared time. We generated a change in the readmission rate variable by subtracting the last readmission rate from the baseline readmission rate (readmission rate in 2010-2013 − readmission rate in 2014-2017). In the fourth stage, we included this change in readmission rate into the third-stage model to examine how changes in the readmission rate affected the time trends of mortality and also examined its interaction with time and squared time. In the final model, we included the following potential confounding variables to the fourth stage model: African American percentage in the HSA, HSA median income, percentage of people living in poverty in the HSA, median age, ownership of hospital (government, for profit), teaching status (teaching vs nonteaching), and acute care hospital beds in the HSA. Within each stage, the models were compared using the Akaike information criterion (AIC) and the Bayesian information criterion (BIC), and the model with the lowest value of each was moved to the next stage of model development. All analyses were performed in Stata 14.1 for Windows (College Station, Texas).
RESULTS
Of the 3,685 acute care hospitals analyzed in the 2010-2013 data cycle for COPD, the 30-day RSRR was 20.7% (1.28), which decreased to 19.6% (1.11) in 2014-2017 (Table 1). During the same period, the 30-day all-cause RSMR increased from 7.8% (1.03) in 2010-2013 to 8.4% (1.11) in 2014-2017. The partitioning of variance showed that 57% of variation in the mortality rate over the study period was due to between-hospital differences.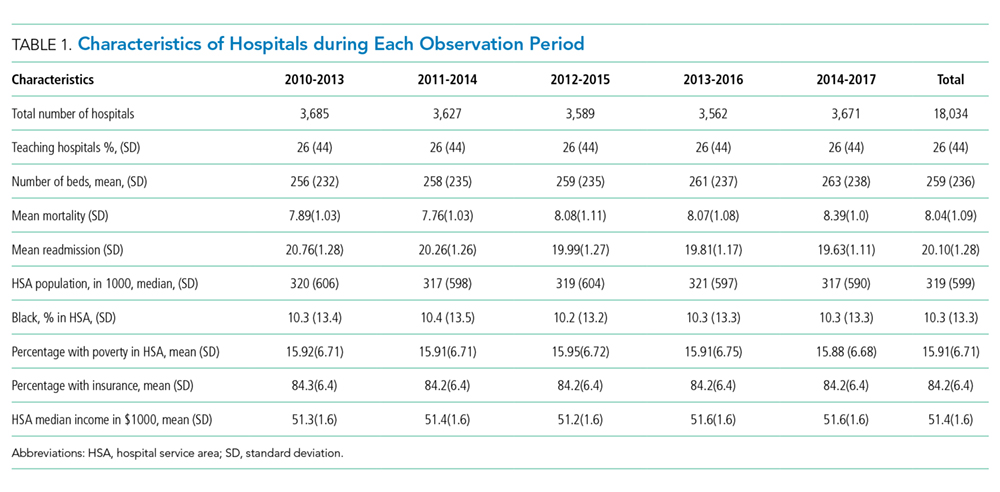
The unconditional growth model examining the linear time trend revealed a 0.13% per year (95% CI = 0.12 to 0.14; P < .0001) increase in mortality rate over the five data cycles. When the squared time variable was added to the model to examine a quadratic trend, both time and squared trend were statistically significant (Table 2) and the AIC and BIC were lower for the quadratic model. Thus, the unconditional growth curve model suggested that the mortality trend was nonlinear and the coefficients demonstrated that not only the mortality rate increased, but the rate of change in the mortality rate was also increasing during the study period.
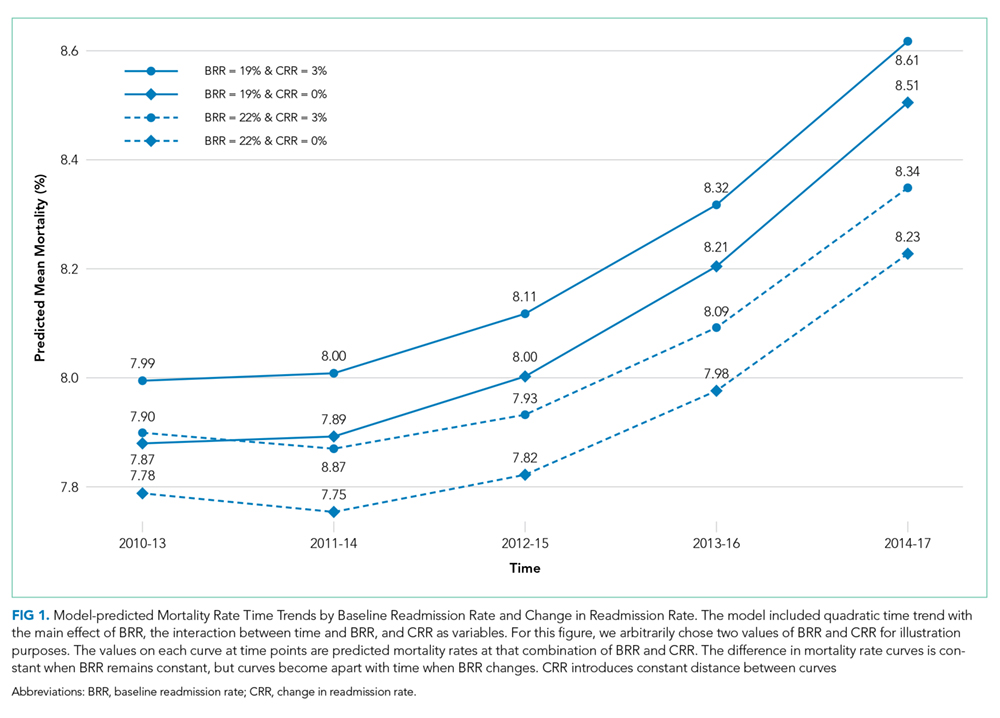
When we added the baseline readmission rate to the abovementioned quadratic growth model, we found an inverse association; each 1% increase in baseline readmission rate was associated with 0.03% (95% CI = −0.05 to −0.005; P = .02) decrease in mortality rate. These findings suggest that hospitals with higher baseline readmission rates also had lower mortality rates. To examine whether the effect of baseline readmission rate on mortality varied over time, we included the interaction term with time in the model and then added the interaction term with squared time. As the AIC and BIC were the lowest for the model with interaction between time and baseline readmission (and not when interaction between squared time and baseline readmission were included), we accepted this model. In this model, although there was no difference in mortality according to readmissions at baseline, each 1% increase in baseline readmission rate was associated with a smaller increase in mortality rate by 0.015% (95% CI = −0.02 to −0.01; P < .0001; Table 2 and Figure 1). These findings suggest that hospitals with higher readmission rates at baseline had a smaller increase in mortality rate during the study period than those with lower readmission rates.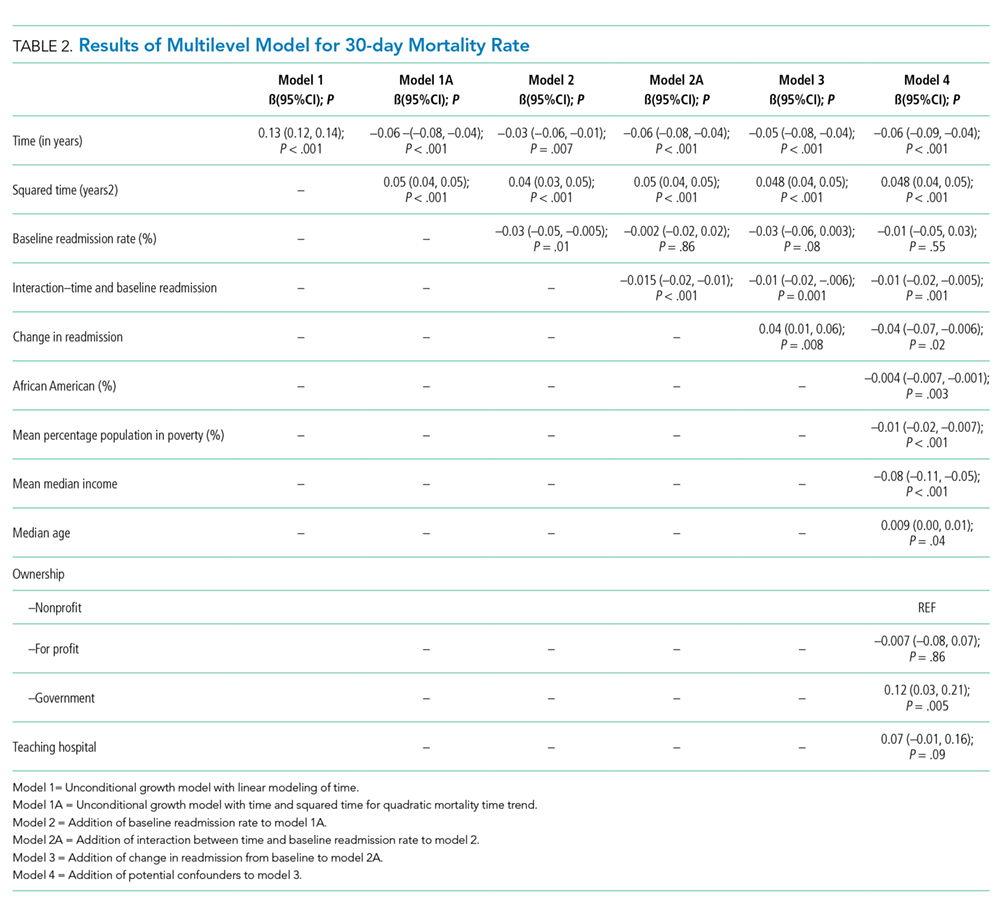
Inclusion of change in the readmissions variable in the model showed that each 1% decrease in readmission rate during the study period was associated with 0.04% (95% CI = 0.01 to 0.06; P = .008) increase in mortality. However, the interaction between change in readmission and time was not significant and the AIC and BIC of the model were higher than the model without interaction. Therefore, we retained the model without the interaction term and included other potential confounding variables to build our final model. Thus, although hospitals with different baseline readmission rates had different rates of change in mortality rate, the change in readmission rate had a consistent effect on the mortality rate. Including potential confounders in the model did not change the results; the mortality rate and the change in the mortality rate increased during the study period, a high baseline readmission rate was associated with a lower yearly increase in mortality, and a larger decrease in readmission rate was associated with a higher mortality rate (Table 2).