Impact of the Choosing Wisely® Campaign Recommendations for Hospitalized Children on Clinical Practice: Trends from 2008 to 2017


BACKGROUND: The Choosing Wisely® Campaign (CWC) was launched in 2012. Five recommendations to reduce the use of “low-value” services in hospitalized children were published in 2013.
OBJECTIVES: The aim of this study was to estimate the frequency and trends of utilization of these services in tertiary children’s hospitals five years before and after the publication of the recommendations.
METHODS: We conducted a retrospective, longitudinal analysis of hospitalizations to 36 children’s hospitals from 2008 to 2017. The “low-value” services included (1) chest radiograph (CXR) for asthma, (2) CXR for bronchiolitis, (3) relievers for bronchiolitis, (4) systemic steroids for lower respiratory tract infection (LRTI), and (5) acid suppressor therapy for uncomplicated gastroesophageal reflux (GER). We estimated the annual percentages of the use of these services after risk adjustment, followed by an interrupted time series (ITS) analysis to compare trends before and after the publication of the recommendations.
RESULTS: The absolute decreases in utilization were 36.6% in relievers and 31.5% in CXR for bronchiolitis, 24.1% in acid suppressors for GER, 20.8% in CXR for asthma, and 2.9% in steroids for LRTI. Trend analysis showed that one “low-value” service declined significantly immediately (use of CXR for asthma), and another decreased significantly over time (relievers for bronchiolitis) after the CWC.
CONCLUSIONS: There was some decrease in the utilization of “low-value” services from 2008 to 2017. Limited changes in trends occurred after the publication of the recommendations. These findings suggest a limited impact of the CWC on clinical practice in these areas. Additional interventions are required for a more effective dissemination of the CWC recommendations for hospitalized children.
© 2019 Society of Hospital Medicine
A joint effort between the CHA and the participating hospitals ensures the quality of the data submitted, as previously described.8 These data are subjected to a routine quality check with each submission and within each report. Data were fully deidentified for this study. In total, 36 PHIS hospitals met the strict quality standards for inclusion of submitted data. The remaining hospitals were excluded because they did not have complete data or had incomplete billing information.
For external benchmarking purposes, PHIS participating hospitals provide encounter data, including demographics, diagnoses, and procedures (International Classification of Diseases versions 9 and 10).9,10 The transition from ICD-9 to ICD-10 in the US took place during the study period. However, the CHA completed a process of translating and mapping all ICD-9 codes to every possible equivalent ICD-10 code in the PHIS database. Thus, the change from ICD-9 to ICD-10 should not have had any significant effect on population definition and data analytics, including trend analysis.
For each condition, the study population was divided into the following two cohorts for comparison of the trends: all admissions from January 1, 2008 to December 31, 2012 (before) and all admissions from January 1, 2013 to December 31, 2017 (after) the CWC-PHM recommendations were published.
This study was determined to be nonhuman subject research and was therefore exempted by Nicklaus Children’s Hospital Human Research Protection Program.
Outcomes
The outcomes for this study were the percentages of patients receiving the not-recommended “low-value” services targeted by the CWC-PHM recommendations. For this purpose, four of the five recommendations were translated into the following five metrics, operationalized in the PHIS database and displayed in the “Choosing Wisely” report card:6
1. Percentage of patients with uncomplicated asthma receiving chest radiograph (CXR).
2. Percentage of patients with uncomplicated bronchiolitis receiving CXR.
3. Percentage of patients with uncomplicated bronchiolitis receiving bronchodilators.
4. Percentage of patients with lower respiratory tract infection (LRTI) receiving systemic corticosteroids (relievers).
5. Percentage of patients with uncomplicated gastroesophageal reflux (GER) receiving acid suppressor therapy.
The fifth recommendation—limiting the use of continuous pulse oximetry unless the patient is receiving supplemental oxygen—could not be operationalized in the PHIS database because of inconsistent reporting of these resources.6
The resulting percentages represent nonadherence to the recommendations, suggesting overuse of the specific “low-value” intervention. As such, a decreasing trend over time is the desired direction of improvement.
The definition of “uncomplicated” conditions and the metrics are presented in Table 1. A complete list of the inclusion and exclusion criteria to define “uncomplicated” conditions and the complete list of the clinical translation codes used in PHIS to identify the “low-value” services are presented as an electronic supplement.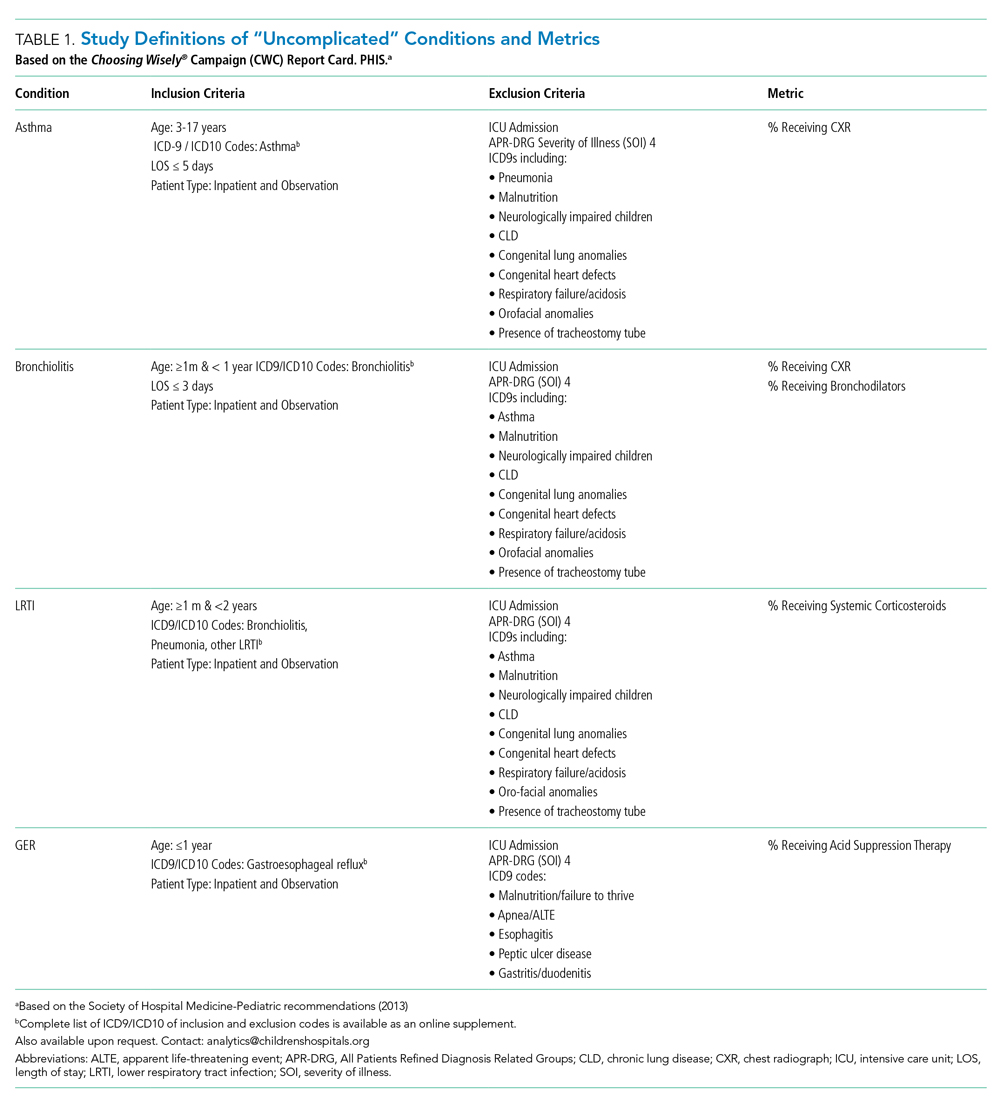
Statistical Analyses
We compared the demographic and clinical characteristics of the various cohorts before and after the release of the CWC-PHM recommendations—the intervention—using chi-square statistics. To assess the individual hospital-level trends over time for each measure, we modeled the patient-level data of each hospital using generalized linear mixed effects models with a binomial distribution. These models were adjusted for patient demographic and clinical factors that were found to be significantly different (P < .01) before and after the intervention on bivariate analyses. From these models, we generated adjusted estimates for the quarterly percentages for each hospital. We then conducted an interrupted time series (ITS) using these estimates to compare trends in the five years before (2008-2012) and five years after (2013-2017) the publication of the CWC-PHM recommendations. For the ITS analysis, we used a generalized linear mixed effects model with the quarterly adjusted hospital-level utilization rates of “low-value” services for each cohort as the unit of analysis and a random intercept for each hospital. The model used an autoregressive(1) covariance structure to account for autocorrelation. The ITS allowed us to test our hypothesis by assessing the following two important features: (a) if a significant decrease occurred right after the CWC-PHM recommendations were published (level-change) and/or (b) if the intervention altered the secular trend (slope-change). All statistical analyses were performed using SAS v. 9.4 (SAS Institute, Cary, North Carolina), and P values <.01 were considered to be statistically significant.
