Community Pediatric Hospitalist Workload: Results from a National Survey


As a newly recognized subspecialty, understanding programmatic models for pediatric hospital medicine (PHM) programs is vital to lay the groundwork for a sustainable field. Although variability has been described within university-based PHM programs, there remains no national benchmark for community-based PHM programs. In this report, we describe the workload, clinical services, employment, and perception of sustainability of 70 community-based PHM programs in 29 states through a survey of community site leaders. The median hours for a full-time hospitalist was 1,882 hours/year with those employed by community hospitals working 8% more hours/year and viewing appropriate morning pediatric census as 20% higher than those employed by university institutions. Forty-three out of 70 (63%) site leaders perceived their programs as sustainable, with no significant difference by employer structure. Future studies should further explore root causes for workload discrepancies between community and academic employed programs along with establishing potential standards for PHM program development.
© 2019 Society of Hospital Medicine
Survey Administration
Given the absence of a national registry or database for community-based PHM programs, study participation was solicited through an invitation posted on the American Academy of Pediatrics Section on Hospital Medicine (AAP SOHM) Listserv and the AAP SOHM Community Hospitalist Listserv in May 2018. Invitations were posted twice at two weeks apart. Each research team member completed 6-19 interviews. Responses to survey questions were recorded in REDCap, a secure, web-based data capture instrument.8
Participating in the study was considered implied consent, and participants did not receive a monetary incentive, although respondents were offered deidentified survey data for participation. The study was exempted through the University of Chicago Institutional Review Board.
Data Analysis
Employers were dichotomized as community hospital employer (including primary community hospital employment/private organization) or noncommunity hospital employer (including children’s/university hospital employment or school of medicine). Descriptive statistics were reported to compare the demographics of two employer groups. P values were calculated using two-sample t-tests for the continuous variables and chi-square or Fisher-exact tests for the categorical variables. Mann–Whitney U-test was performed for continuous variables without normality. Analyses were performed using the R Statistical Programming Language (R Foundation for Statistical Computing, Vienna, Austria), version 3.4.3.
RESULTS
Participation and Program Characteristics
We interviewed 70 community-based PHM site directors representing programs across 29 states (Table 1) and five geographic regions: Midwest (34.3%), Northeast (11.4%), Southeast (15.7%), Southwest (4.3%), and West (34.3%). Employer models varied across groups, with more noncommunity hospital employers (57%) than community hospital employers (43%). The top three services covered by pediatric hospitalists were pediatric inpatient or observation bed admissions (97%), emergency department consults (89%), and general newborns (67%). PHM programs also provided coverage for other services, including newborn deliveries (43%), Special Care Nursery/Level II Neonatal Intensive Care Unit (41%), step-down unit (20%), and mental health units (13%). About 59% of programs provided education for family medicine residents, 36% were for pediatric residents, and 70% worked with advanced practice providers. The majority of programs (70%) provided in-house coverage overnight.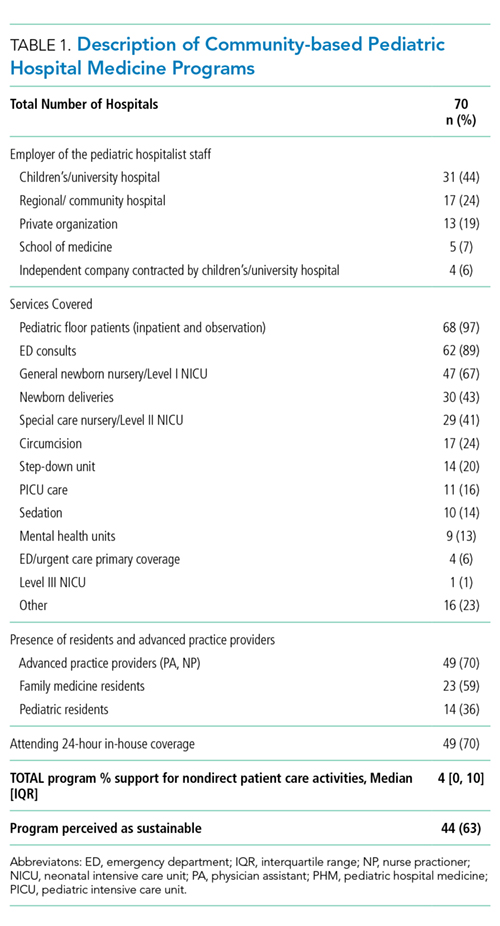
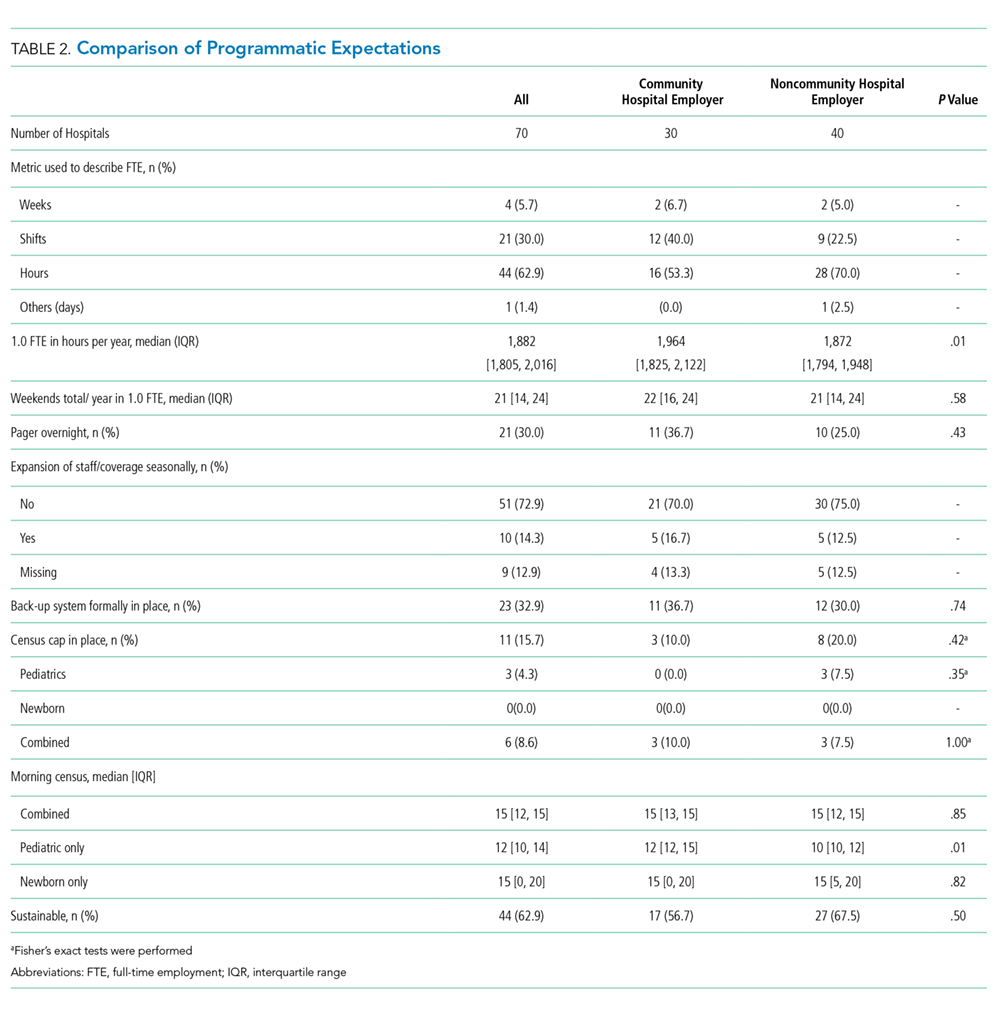
Clinical Work Expectations and Employer Model
Clinical work expectations varied broadly across programs (Table 2). The median expected hours for a 1.0 FTE was 1,882 hours per year (interquartile range [IQR] 1,805, 2,016), and the median expected weekend coverage/year (defined as covering two days or two nights of the weekend) was 21 (IQR 14, 24). Most programs did not expand staff coverage based on seasonality (73%), and less than 20% of programs operated with a census cap. Median support for nondirect patient care activities was 4% (IQR 0,10) of a program’s total FTE (ie, a 5.0 FTE program would have 0.20 FTE support). Programs with community hospital employers had an 8% higher expectation of 1.0 FTE hours/year (P = .01) and viewed an appropriate pediatric morning census as 20% higher (P = .01; Table 2).
Program Sustainability