Achievable Benchmarks of Care for Pediatric Readmissions


BACKGROUND: Most inpatient care for children occurs outside tertiary children’s hospitals, yet these facilities often dictate quality metrics. Our objective was to calculate the mean readmission rates and the Achievable Benchmarks of Care (ABCs) for pediatric diagnoses by different hospital types: metropolitan teaching, metropolitan nonteaching, and nonmetropolitan hospitals.
METHODS: We used a cross-sectional retrospective study of 30-day, all-cause, same-hospital readmission of patients less than 18 years old using the 2014 Healthcare Utilization Project National Readmission Database. For each hospital type, we calculated the mean readmission rates and corresponding ABCs for the 17 most common readmission diagnoses. We define outlier as any hospital whose readmission rate fell outside the 95% CI for an ABC within their hospital type.
RESULTS: We analyzed 690,949 discharges at 525 metropolitan teaching hospitals (550,039 discharges), 552 metropolitan nonteaching hospitals (97,207 discharges), and 587 nonmetropolitan hospitals (43,703 discharges). Variation in readmission rates existed among hospital types; however, sickle cell disease (SCD) had the highest readmission rate and ABC across all hospital types: metropolitan teaching hospitals 15.7% (ABC 7.0%), metropolitan nonteaching 14.7% (ABC 2.6%), and nonmetropolitan 12.8% (ABC not calculated). For diagnoses in which ABCs were available, outliers were prominent in bipolar disorders, major depressive disorders, and SCD.
CONCLUSIONS: ABCs based on hospital type may serve as a better metric to explain case-mix variation among different hospital types in pediatric inpatient care. The mean rates and ABCs for SCD and mental health disorders were much higher and with more outlier hospitals, which indicate high-value targets for quality improvement.
© 2019 Society of Hospital Medicine
For each diagnosis, we calculated the mean readmission rate for hospitals in each hospital type category. We then calculated an ABC for each diagnosis in each hospital type using a four-step process.13,18 First, to control for hospitals with small sample sizes, we adjusted all readmission rates using an adjusted performance fraction ([numerator+1]/[denominator +2]), where the numerator is the number of all-cause 30-day readmissions and the denominator is the number of discharges for the selected diagnosis. Then the hospitals were ordered from lowest (best performing) to highest (worst performing) using the adjusted readmission rate. Third, the number of discharges from the best performing hospital to the worst performing hospital was summed until at least 10% of the total discharges had been accounted for. Finally, we computed the ABC as the average of these best performing hospitals. We only report ABCs for which at least three hospitals were included as best performers in the calculation.13
To evaluate hospital performance on ABCs for each diagnosis, we identified the percent of hospitals in each setting that were outliers. We defined an outlier as any hospital whose 95% confidence interval for their readmission rate for a given diagnosis did not contain the ABC for their hospital type. All the statistical analyses were performed using SAS version 9.3 (SAS Institute, Inc, Cary, North Carolina).
This project was reviewed by the Cincinnati Children’s Hospital Medical Center Institutional Review Board and determined to be nonhuman subjects research.
RESULTS
Hospital-Type Demographics
The 690,949 discharges from 1,664 hospitals were categorized into 525 metropolitan teaching (550,039 discharges, 79.6% of discharges), 552 metropolitan nonteaching (97,207 discharges, 14% of discharges), and 587 nonmetropolitan hospitals (43,703 discharges, 6.3% of discharges; Table 1). There were significant differences in the patient composition among the three hospital settings. Nonmetropolitan hospitals had a larger percentage of younger patients (aged 0-4 years, P < .001), prominence of first and second quartile median household income, and fewer medically complex patients (48.3% No CCC/No CCI versus 25.5% metropolitan teaching and 33.7% nonteaching, P < .001). Disposition home was over 96% in all three hospital types; however, the metropolitan teaching had a greater percentage of patients discharged to home health versus metropolitan nonteaching and nonmetropolitan hospitals (2.3% versus 0.5%; P < .001).
Readmission Rates
The 17 most common diagnoses based on the number of all-cause 30-day same-hospital readmissions, were categorized into two surgical, seven acute/infectious, four chronic, and four mental health diagnoses (Table 2). Readmission rates varied based on diagnosis and hospital type (Table 2). Overall, mean readmission rates were low, especially in acute respiratory tract related diseases. For chronic diseases, asthma readmissions were consistently low in all three hospital types, whereas sickle cell disease had the highest readmission rate in all three hospital types.
Achievable Benchmarks of Care by Hospital Type
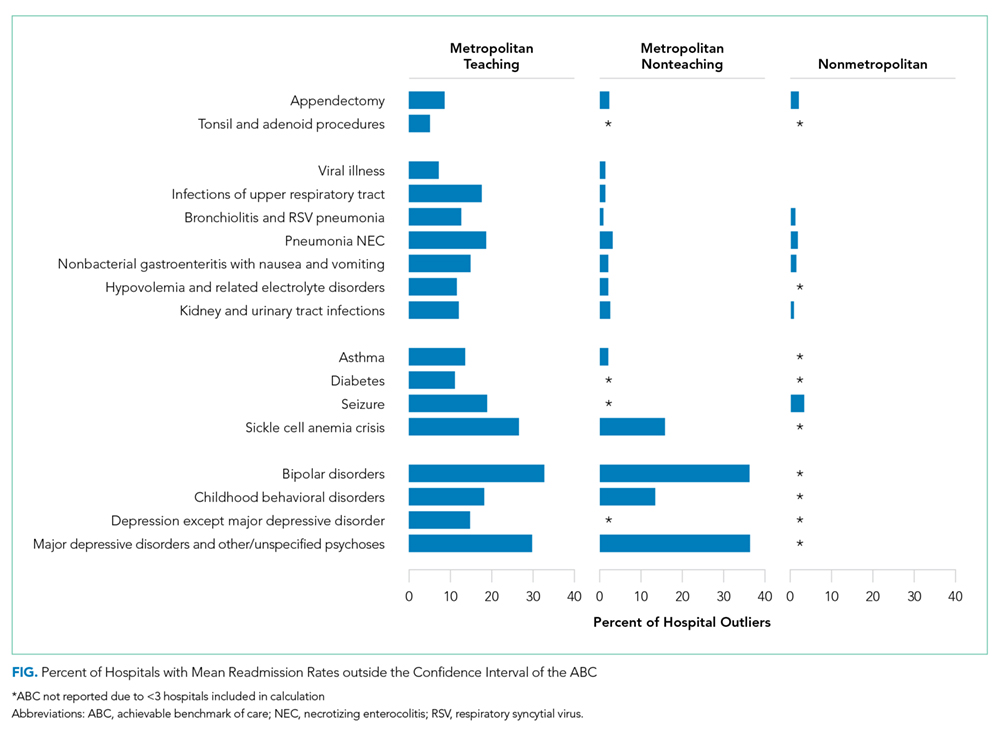
The diagnoses for which ABC could be calculated across all three hospital types included appendectomy and four acute conditions (bronchiolitis, pneumonia, nonbacterial gastroenteritis, and kidney/urinary tract infections). For these conditions, metropolitan teaching hospitals had a more significant percentage of outlier hospitals compared to metropolitan nonteaching and nonmetropolitan hospitals. The percent of outlier hospitals varied by diagnosis and hospital type (Figure).