Use of Advance Care Planning Billing Codes for Hospitalized Older Adults at High Risk of Dying: A National Observational Study


We analyzed advance care planning (ACP) billing for adults aged 65 years or above and who were managed by a large national physician practice that employs acute care providers in hospital medicine, emergency medicine and critical care between January 1, 2017 and March 31, 2017. Prompting hospitalists to answer the validated “surprise question” (SQ; “Would you be surprised if the patient died in the next year?”) for inpatient admissions served to prime hospitalists and triggered an icon next to the patient’s name. Among 113,621 hospital-based encounters, only 6,146 (5.4%) involved a billed ACP conversation: 8.3% among SQ-prompted who answered “no” and 4.1% SQ-prompted who answered “yes” (for non-SQ prompted cases, the fraction was 3.5%; P < .0001). ACP conversations were associated with a comfort-focused care trajectory. Low ACP rates among even those with high hospitalist-predicted mortality risk underscore the need for quality improvement interventions to increase hospital-based ACP.
© 2019 Society of Hospital Medicine
Beginning in 2017, hospitalists were required to answer the validated Surprise Question4 (SQ; “Would you be surprised if the patient died in the next year?”) for all admitted patients aged 65 years and older. The SQ is useful because it is intuitive and not burdensome for physicians to answer. Moreover, it is predictive of mortality. The pooled prognostic characteristics of the SQ across multiple populations for predicting the outcome of death at 6 months to 18 months include a sensitivity of 67.0% (95% confidence interval [CI] 55.7%-76.7%), a specificity of 80.2% (95% CI 73.3%-85.6%), a positive likelihood ratio of 3.4 (95% CI 2.8–4.1), a negative likelihood ratio of 0.41 (95% CI 0.32-0.54), a positive predictive value of 37.1% (95% CI 30.2%-44.6%), and a negative predictive value of 93.1% (95% CI 91.0%-94.8%).5 The SQ primed the admitting physician and triggered an “EoL” (end-of-life) icon next to the patient’s name on the hospitalists’ handheld electronic patient census.
We summarized ACP billing rates and used mixed-effects regression to estimate adjusted ACP rates accounting for patient covariates and clustering at the provider and hospital level. Patient covariates included age; answer to the SQ [“yes,” “no,” or “missing”]); and the presence or absence of seven comorbidities: dementia, heart failure, chronic obstructive pulmonary disease, renal failure, liver failure, metastatic cancer, and nonmetastatic cancer. We quantified the magnitude of provider and hospital variation in ACP rates by using the intraclass correlation coefficient (ICC).
RESULTS
In the first quarter of 2017, hospitalists admitted 113,612 patients aged 65 years and older. Hospitalists were prompted to answer the SQ for 73,731 (65%) of the patients. They were not prompted to answer the SQ for 39,881 (35%) of the patients (ie, missing data for the SQ). Reasons for not prompting include delayed implementation at a site and the patient not being admitted to the hospital (eg, managed on observation status). When prompted, hospitalists answered “no” to the SQ for 41,276/73,731 (56%) of admissions.
Only 6,146/113,612 (5.4%) of all admissions involved a billed ACP conversation. Rates were highest among SQ-prompted/answer “no” cases (8.3%) compared with SQ-prompted/answer “yes” cases (4.1%) and non-SQ-prompted cases (3.5%), with all pairwise differences being statistically significant (P values “yes” vs “no” = .0079, “yes” vs not prompted = .0043, “no” vs not prompted < .0001; see Table 1).
In addition to being more likely to have a “no” response to the SQ, those with a billed ACP conversations were older (80 vs 78, P < .001); more likely to be diagnosed with dementia (5.9% vs 3.5%, P < .001), congestive heart failure (12.3% vs 9.9%, P < .001), and cancer (6.1% vs 3.3%, P < .001); more likely to die during the admission (16.5% vs 10.9%, P < .001); and, conditional on survival to discharge, more likely to be discharged with hospice (17% vs 3%, P < .001) than those without (Table 2).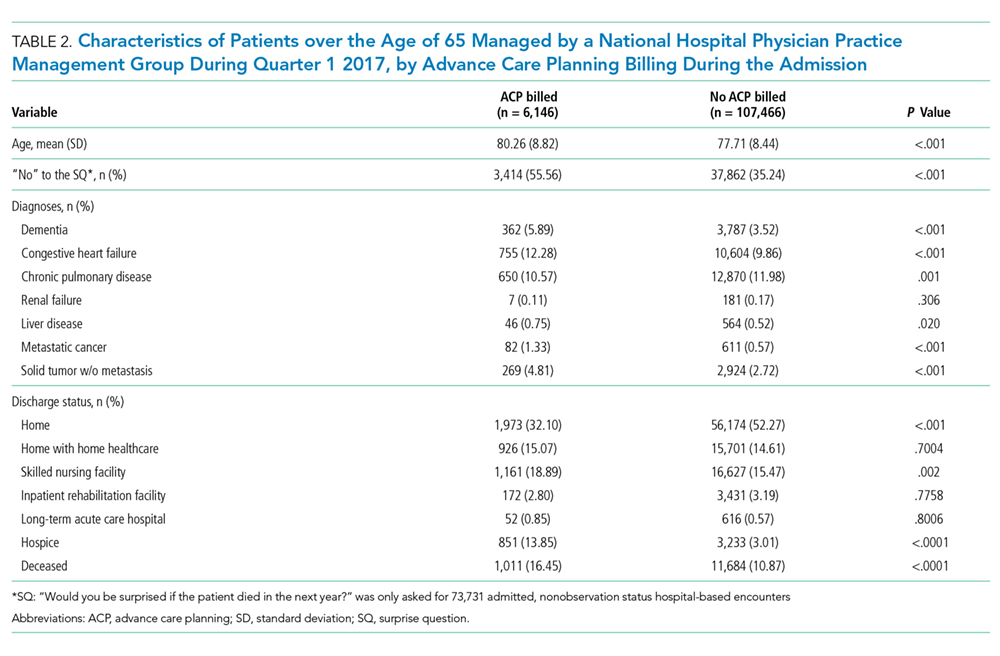
At the hospital level, ACP rates varied from 0% to 35% (mean 5.2%) of all admissions. In analyses restricted to physicians seeing at least 30 patients 65 years of age and older during the quarter, physician-level ACP rates varied from 0% to 93% (mean 5.4%). The majority of all ACP discussions were attributable to one-quarter of physicians. One-third of physicians never billed for ACP.
In a hierarchical logistic regression model accounting for observable patient characteristics and clustering at the physician and hospital level, the adjusted ACP rate for an “average” patient (age 77.85 with the most common clinical conditions) was 13.6% if the hospitalist answered “no” to the SQ, 9.6% if the hospitalist answered “yes,” and 10.1% if the hospitalist was not asked the SQ (P value of difference < .0001). From this model, we also calculated an ICC at the physician level of 0.044 and at the hospital level of 0.079. The physician level ICC corresponds to a 4.5% absolute increase in ACP when one moves from a physician at the mean to a physician 1 SD above the mean (ie, moving 1 SD up the scale of the latent variable underlying the random effect). The hospital level ICC corresponds to a 6.3% absolute increase in ACP when one moves from a hospital at the mean to a hospital 1 SD above the mean. The 4.5% absolute increase in ACP due to physician practice patterns and 6.3% absolute increase in ACP due to hospital practice patterns are both greater than the estimated increase in ACP from the hospitalist answering “no” instead of “yes” to the SQ (3.6%).