Prevalence and Postdischarge Outcomes Associated with Frailty in Medical Inpatients: Impact of Different Frailty Definitions


We compared prevalence estimates and prognostication if frailty were defined using the face-to-face Clinical Frailty Scale (CFS) or the administrative-data-derived Hospital Frailty Risk Score (HFRS). We evaluated 489 adults from a prospective cohort study of medical patients being discharged back to the community; 276 (56%) were deemed frail (214 [44%] on the HFRS and 161 [33%] on the CFS), but only 99 (20%) met both frailty definitions (kappa 0.24, 95% CI 0.16-0.33). Patients classified as frail on the CFS exhibited significantly higher 30-day readmission/death rates, 19% versus 10% for those not frail (aOR [adjusted odds ratio] 2.53, 95% CI 1.40-4.57) and 21% versus 6% for those aged >65 years (aOR 4.31, 95% CI 1.80-10.31). Patients with HFRS-defined frailty exhibited higher 30-day readmission/death rates that were not statistically significant (16% vs 11%, aOR 1.62 [95% CI 0.95-2.75] in all adults and 14% vs 11%, aOR 1.24 [95% CI 0.58-2.83] in those aged >65 years).
© 2019 Society of Hospital Medicine
RESULTS
Of the 499 patients in our original cohort,7 we could not link 10 to the administrative data to calculate HFRS, and thus this study sample is only 489 patients (mean age 64 years, 50% women, 52% older than 65 years, a mean of 4.9 comorbidities, and median length of stay five days).
Overall, 276 (56%) patients were deemed frail according to at least one assessment (214 [44%] on the HFRS [35% intermediate risk and 9% high risk] and 161 [33%] on the CFS), and 99 (20%) met both frailty definitions (Appendix Figure). Among the 252 patients aged >65 years, 66 (26%) met both frailty definitions and 166 (66%) were frail according to at least one assessment. Agreement between HFRS and the CFS (kappa 0.24, 95% CI 0.16-0.33) was poor. The CFS definition of frailty was 46% sensitive and 77% specific in classifying frail patients compared with HFRS-defined frailty.
As we reported earlier,4 patients deemed frail were generally similar across scales in that they were older, had more comorbidities, more prescriptions, longer lengths of stay, and poorer quality of life than nonfrail patients (all P < .01, Table 1). However, patients classified as frail on the HFRS only but not meeting the CFS definition were younger, had higher quality of life, and despite a similar Charlson Score and number of comorbidities were much more likely to have been living independently prior to admission than those classified as frail on the CFS.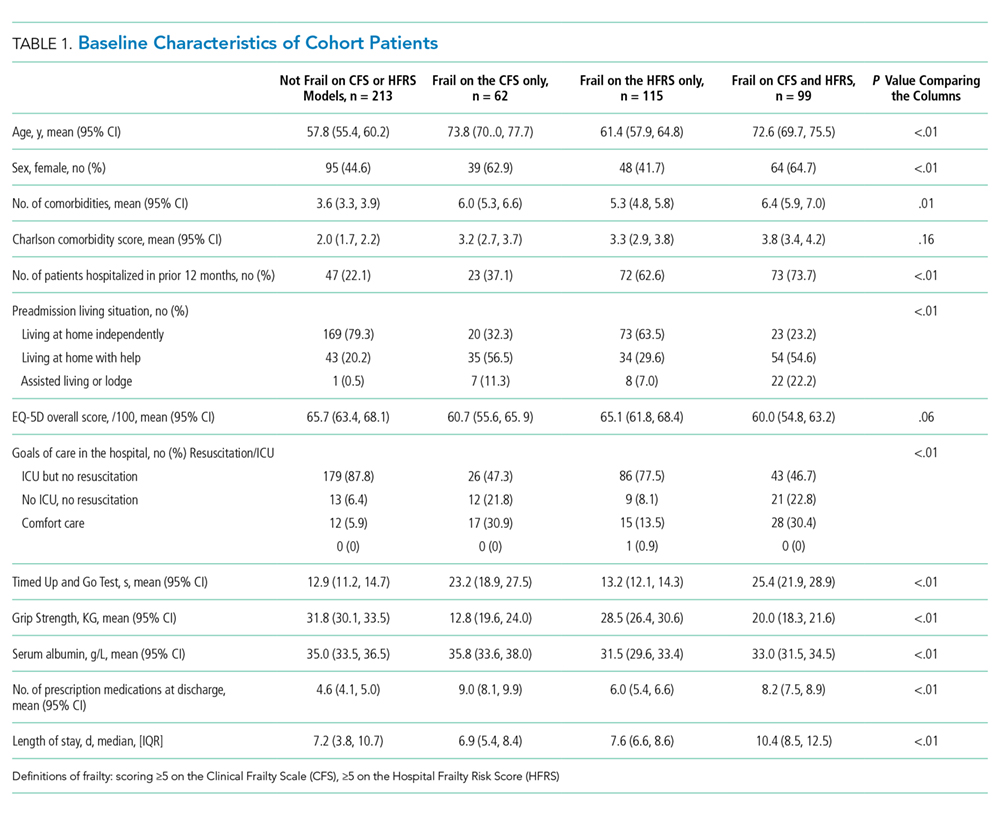
Death or unplanned readmission within 30 days occurred in 13.3% (65 patients), with most events being readmissions (62, 12.7%). HFRS-defined frail patients exhibited higher 30-day death/readmission rates (16% vs 11% for not frail, P = .08; 14% vs 11% in the elderly, P = .5), which was not statistically significantly different from the nonfrail patients even after adjusting for age and sex (aOR [adjusted odds ratio] 1.62, 95% CI 0.95-2.75 for all adults; aOR 1.24, 95% CI 0.58-2.63 for the elderly). CFS-defined frail patients had significantly higher 30-day readmission/death rates (19% vs 10% for not frail, aOR 2.53, 95% CI 1.40-4.57 for all adults and 21% vs 6% in the elderly, aOR 4.31, 95% CI 1.80-10.31).
Adding the HFRS results to the CFS-based predictive models added little new information, with an integrated discrimination improvement of only 0.009 that was not statistically significant (P = .09, Table 2). In fact, the HFRS was not an independent predictor of postdischarge outcomes after adjusting for age and sex. Although predictive models incorporating the CFS demonstrated the best C statistics, none of the models had high C statistics (ranging between 0.54 and 0.64 for all adults and between 0.55 and 0.68 for those aged >65 years). Even when the frailty definitions were examined as continuous variables, the C statistics were similar as for the dichotomized analyses (0.64 for CFS and 0.58 for HFRS) and the correlation between the two remained weak (Spearman’s correlation coefficient 0.34).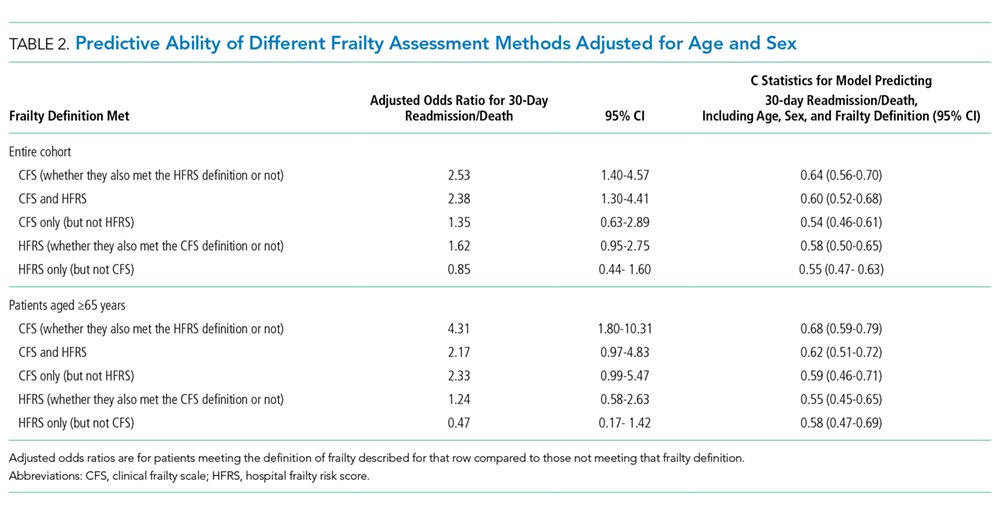
DISCUSSION
We have demonstrated that the prevalence of frailty in patients being discharged from medical wards was high, with the HFRS (44%) being higher than the CFS (33%), and that only 46% of patients deemed frail on the HFRS were also deemed frail on the CFS. We confirm the report by the developers of the HFRS that there was poor correlation between the CFS cumulative deficit model and the administrative-data-based HFRS model in our cohort, even among those older than 65 years.
