Examining the Utility of 30-day Readmission Rates and Hospital Profiling in the Veterans Health Administration


BACKGROUND: The Veterans Health Administration (VA) reports hospital-specific 30-day risk-standardized readmission rates (RSRRs) using CMS-derived models.
OBJECTIVE: The aim of this study was to examine and describe the interfacility variability of 30-day RSRRs for acute myocardial infarction (AMI), heart failure (HF), and pneumonia as a means to assess its utility for VA quality improvement and hospital comparison.
RESEARCH DESIGN: A retrospective analysis of VA and Medicare claims data using one-year (2012) and three-year (2010-2012) data given their use for quality improvement or for hospital comparison, respectively.
SUBJECTS: This study included 3,571 patients hospitalized for AMI at 56 hospitals, 10,609 patients hospitalized for HF at 102 hospitals, and 10,191 patients hospitalized for pneumonia at 106 hospitals.
MEASURES: Hospital-specific 30-day RSRRs for AMI, HF, and pneumonia hospitalizations were calculated using hierarchical generalized linear models.
RESULTS: Of 164 qualifying VA hospitals, 56 (34%), 102 (62%), and 106 (64%) qualified for analysis based on CMS criteria for AMI, HF, and pneumonia cohorts, respectively. Using 2012 data, we found that two hospitals (2%) had CHF RSRRs worse than the national average (+95% CI), whereas no hospital demonstrated worse-than-average risk-stratified readmission Rate (RSRR; +95% CI) for AMI or pneumonia. After increasing the number of facility admissions by combining three years of data, we found that four (range: 3.5%-5.3%) hospitals had RSRRs worse than the national average (+95% CI) for all three conditions.
CONCLUSIONS: The Centers for Medicare and Medicaid Services-derived 30-day readmission measure may not be a useful measure to distinguish VA interfacility performance or drive quality improvement given the low facility-level volume of such readmissions.
© 2019 Society of Hospital Medicine
Analysis
We examined and reported the distribution of patient and clinical characteristics at the hospital level. For each condition, we determined the number of hospitals that had a sufficient number of admissions (n ≥ 25) to be included in the analyses. We calculated the mean, median, and interquartile range for the observed unadjusted readmission rates across all included hospitals.
Similar to methods used by CMS, we used one year of data in the VA to assess hospital quality and variation in facility performance. First, we calculated the 30-day RSRRs using one year (2012) of data. To assess how variability changed with higher facility volume (ie, more years included in the analysis), we also calculated the 30-day RSRRs using two and three years of data. For this, we identified and quantified the number of hospitals whose RSRRs were calculated as being above or below the national VA average (mean ± 95% CI). Specifically, we calculated the number and percentage of hospitals that were classified as either above (+95% CI) or below the national average (−95% CI) using data from all three time periods. All analyses were conducted using SAS Enterprise Guide, Version 7.1. The SAS statistical packages made available by the CMS Measure Team were used to calculate RSRRs.
RESULTS
Patient Characteristics
Patients were predominantly older males (98.3%). Among those hospitalized for AMI, most of them had a history of previous coronary artery bypass graft (CABG) (69.1%), acute coronary syndrome (ACS; 66.2%), or documented coronary atherosclerosis (89.8%). Similarly, patients admitted for HF had high rates of CABG (71.3%) and HF (94.6%), in addition to cardiac arrhythmias (69.3%) and diabetes (60.8%). Patients admitted with a diagnosis of pneumonia had high rates of CABG (61.9%), chronic obstructive pulmonary disease (COPD; 58.1%), and previous diagnosis of pneumonia (78.8%; Table 1). Patient characteristics for two and three years of data are presented in Supplementary Table 1.
VA Hospitals with Sufficient Volume to Be Included in Profiling Assessments
There were 146 acute-care hospitals in the VA. In 2012, 56 (38%) VA hospitals had at least 25 admissions for AMI, 102 (70%) hospitals had at least 25 admissions for CHF, and 106 (73%) hospitals had at least 25 admissions for pneumonia (Table 1) and therefore qualified for analysis based on CMS criteria for 30-day RSRR calculation. The study sample included 3,571 patients with AMI, 10,609 patients with CHF, and 10,191 patients with pneumonia.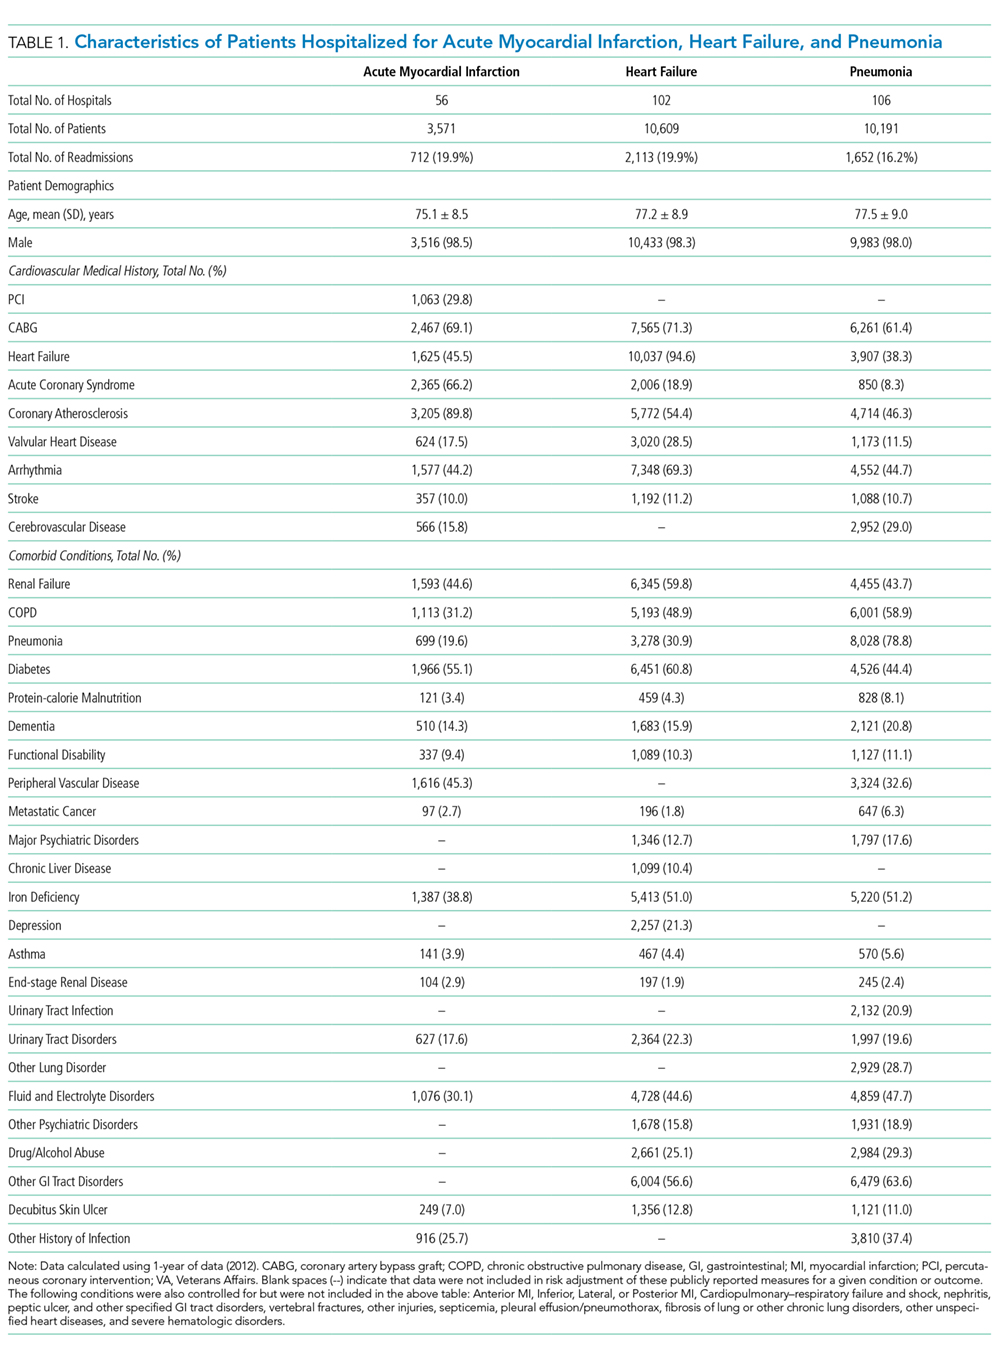
30-Day Readmission Rates
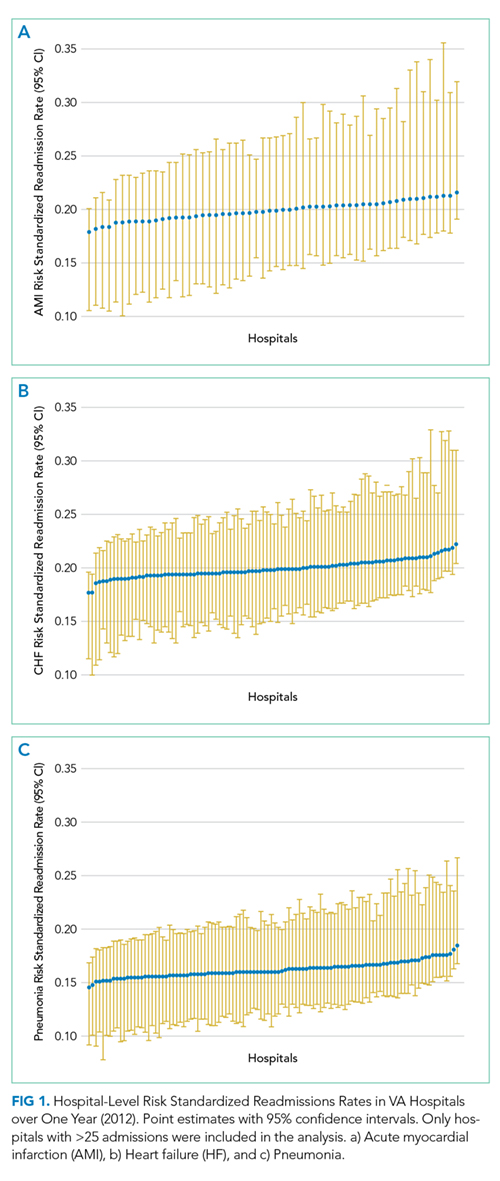
The mean observed readmission rates in 2012 were 20% (95% CI 19%-21%) among patients admitted for AMI, 20% (95% CI 19%-20%) for patients admitted with CHF, and 15% (95% CI 15%-16%) for patients admitted with pneumonia. No significant variation from these rates was noted following risk standardization across hospitals (Table 2). Observed and risk-standardized rates were also calculated for two and three years of data (Supplementary Table 2) but were not found to be grossly different when utilizing a single year of data.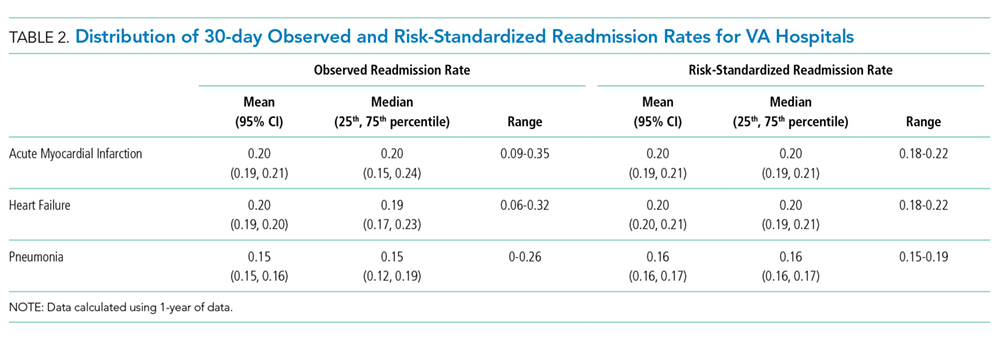
In 2012, two hospitals (2%) exhibited HF RSRRs worse than the national average (+95% CI), whereas no hospital demonstrated worse-than-average rates (+95% CI) for AMI or pneumonia (Table 3, Figure 1). Similarly, in 2012, only three hospitals had RSRRs better than the national average (−95% CI) for HF and pneumonia.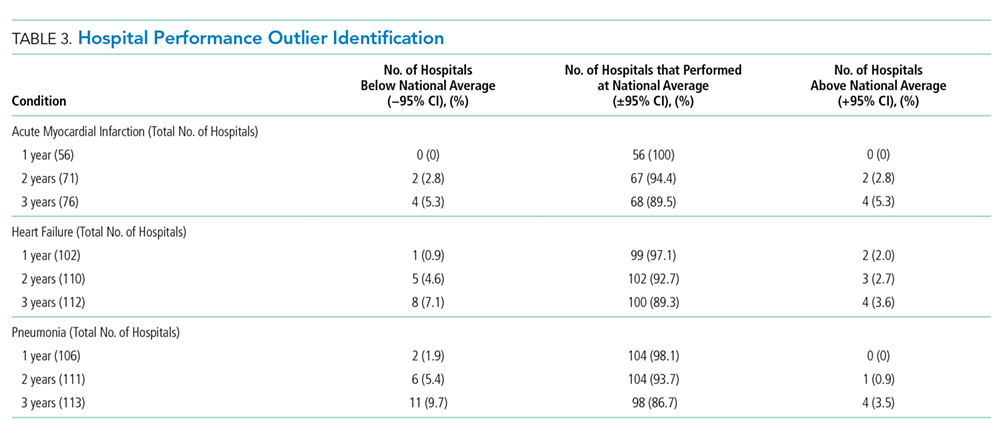
We combined data from three years to increase the volume of admissions per hospital. Even after combining three years of data across all three conditions, only four hospitals (range: 3.5%-5.3%) had RSRRs worse than the national average (+95% CI). However, four (5.3%), eight (7.1%), and 11 (9.7%) VA hospitals had RSRRs better than the national average (−95% CI).